avatar
Prof. Michael Fuhrer @michaelsfuhrer.bsky.social

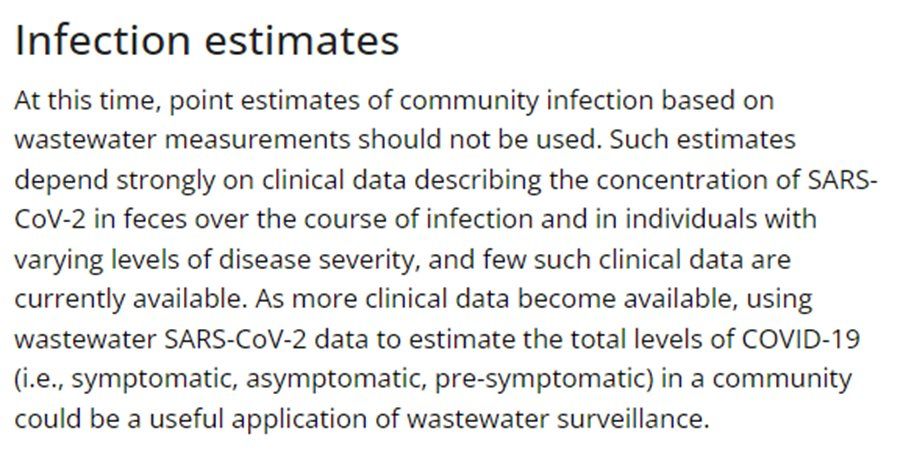
I agree. I would very much like to know how the prevalence of covid-19 infections is changing over time. But we don't have a scientific way to estimate this from wastewater. The CDC used to say this on their old wastewater data explainer website (now archived): archive.cdc.gov/www_cdc_gov/...

image
aug 12, 2025, 10:32 pm • 1 0

Replies

avatar
Prof. Michael Fuhrer @michaelsfuhrer.bsky.social

Of course the CDC tracks all sorts of metrics over time (test positivity, emergency department visits, hospitalizations, deaths). But the variation in these metrics reflects both prevalence and changes in immunity in the population.

aug 12, 2025, 10:32 pm • 1 0 • view
avatar
Prof. Michael Fuhrer @michaelsfuhrer.bsky.social

I'll point to a couple metrics which *might* offer a hint on trends in prevalence. In this thread I looked at hospitalizations in ages 0-1, and deaths in ages 0-1. This is a new cohort each year, with little immunity. Both metrics are down ~70% since the peak in 2022. bsky.app/profile/mich...

aug 12, 2025, 10:32 pm • 2 0 • view
avatar
Prof. Michael Fuhrer @michaelsfuhrer.bsky.social

I wish we had something like the UKHSA winter coronavirus infection surveys (now no longer happening). www.gov.uk/government/s...

aug 12, 2025, 10:32 pm • 1 0 • view
avatar
Prof. Michael Fuhrer @michaelsfuhrer.bsky.social

WellKiwis is an interesting longitudinal study in NZ, but they only track symptomatic infections. They do make their reports public. I think the data are interesting (there has been a huge drop in symptomatic covid-19) www.wellkiwis.co.nz

aug 12, 2025, 10:32 pm • 1 0 • view