
Something interesting is going on with the latest covid-19 wave in the US. Hospitalizations in ages 0-1 are up much more than in other ages. (More accurately: other ages remain unusually low, ages 0-1 look normal.) 1/
Something interesting is going on with the latest covid-19 wave in the US. Hospitalizations in ages 0-1 are up much more than in other ages. (More accurately: other ages remain unusually low, ages 0-1 look normal.) 1/
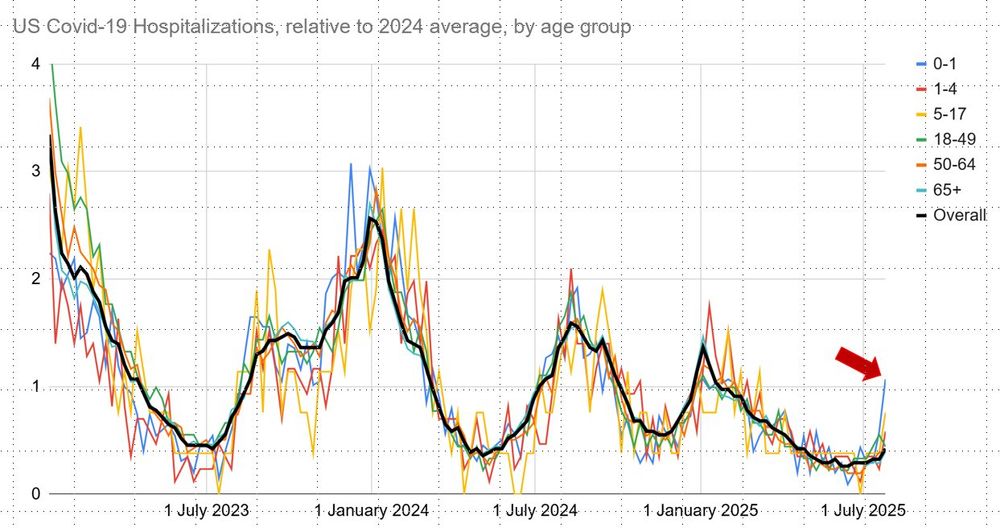
Here I've normalized each age group's hospitalizations to its 2024 average. The overall rate (all ages) is in black. The different ages follow each other fairly well up and down the waves. But the latest data (only up to 26 July 2025) shows 0-1s increasing well above the pack. 2/
There's been some discussion on the other site already about the rise in emergency department visits in young children, which are seeming to lead this latest wave, and whether this is an annual effect due to changes in transmission around the holidays. 3/
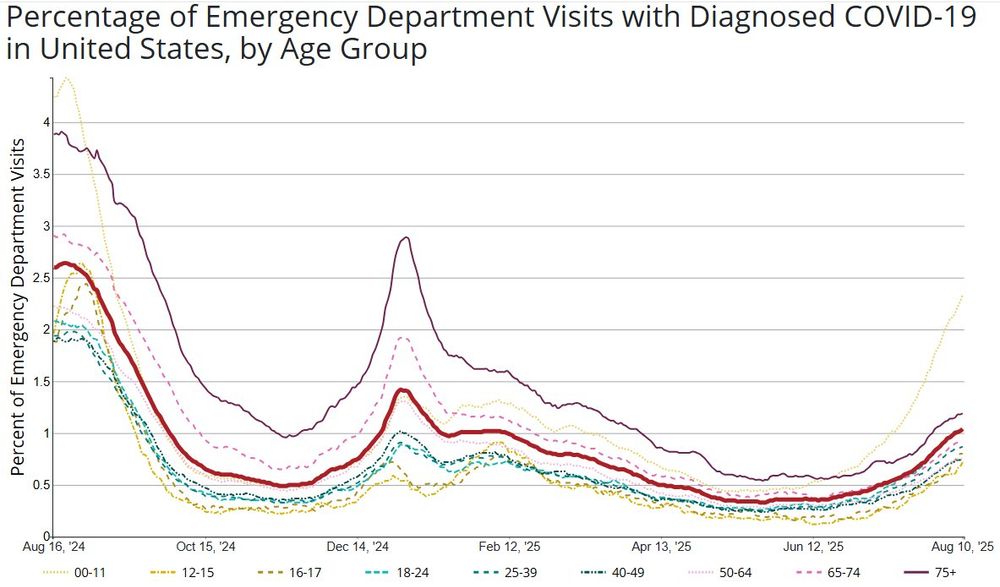
I note that the rise in hospitalizations in ages 0-1 is unprecedented in previous waves. It suggests to me that they may be driving ED numbers in ages 0-11. (Maybe on top of the seasonal effect due to holidays.) 4/

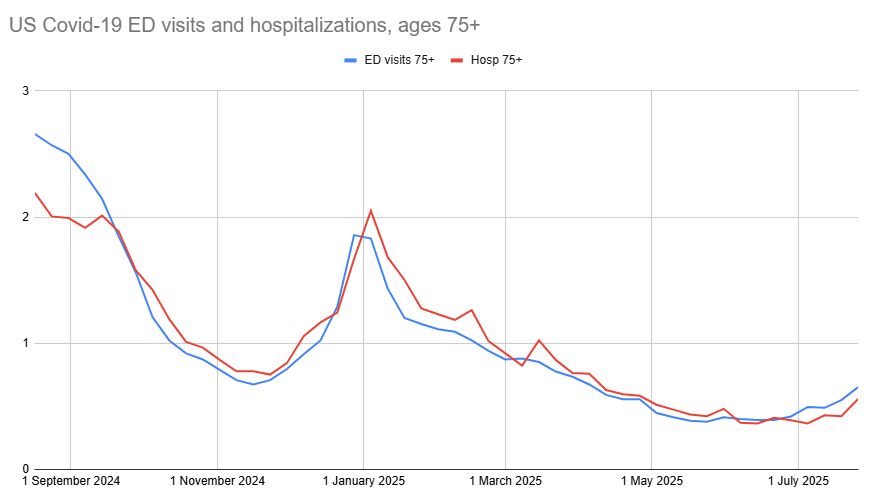
Important: There is no evidence for an increase in severity in this latest covid-19 wave. Among ages 75+ (the worst affected by severe covid-19) emergency department visits and hospitalizations remain far lower than last summer. 5/
What could be going on? Infants (ages 0-1) are a new cohort each year, with little acquired immunity. They also aren't drivers of transmission. It's likely that the infection rate in infants simply reflects prevalence in older children and younger adults (families). 6/
The hospitalization rate in infants is similar to (or a little lower than) last summer. It seems plausible that this reflects prevalence which is normal for a summer wave. 7/

In which case, severe disease is down for those with acquired immunity (vaccinations and/or prior infections). This is a hypothesis at this point, and needs more observations. But worth watching. 8/8