As it happens I am awaiting getting an old snapshot of the exact fleet composition to compare to the current, so I will have some more detail (beyond imports) to talk about at some point.
As it happens I am awaiting getting an old snapshot of the exact fleet composition to compare to the current, so I will have some more detail (beyond imports) to talk about at some point.

I am also interested in the per-capita chart.
I can do an exact imports/capita graph at the end of this week (after the release of population data on Thursday), and my guess is I will have been supplied with and done something with fleet data in the next four weeks.
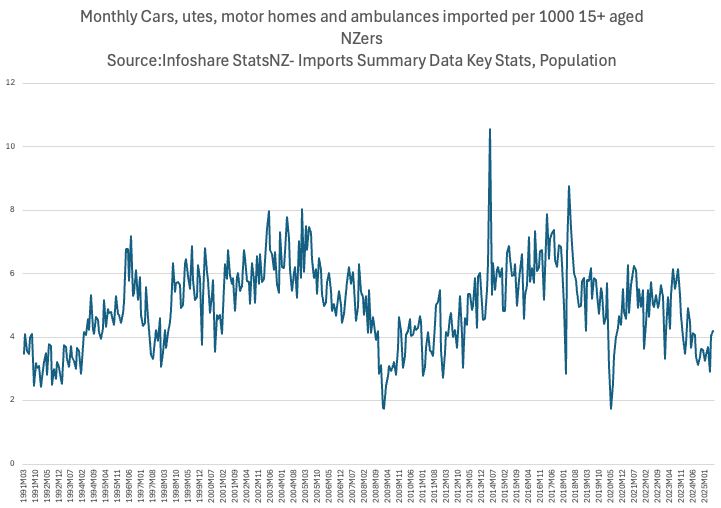
Here is monthly imports per capita (monthly 15+ population- driving age). More fleet stuff to come when I get some data in the next month.
Wow. Fantastic. Thats just used? Or both?
I think I remember seeing at this level it is both (Infoshare : Imports and exports : Key Stats 7.02 Quantity of Principle imports - by commodity (SH) (Monthly) the underlying data is available from www.stats.govt.nz/large-datase... and breaks down to "new motor" and "used motor" and exact types
Thanls David. Super usefyl
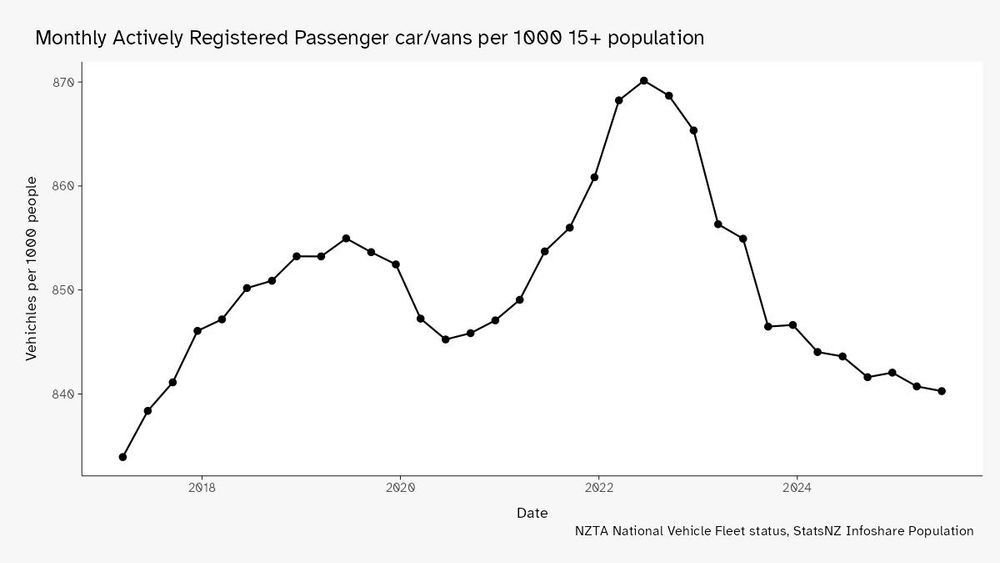
And this is number of actively registered passenger cars and vans per driving age capita since 2017. Some lockdown affects, but it is another dataset suggesting peak car.

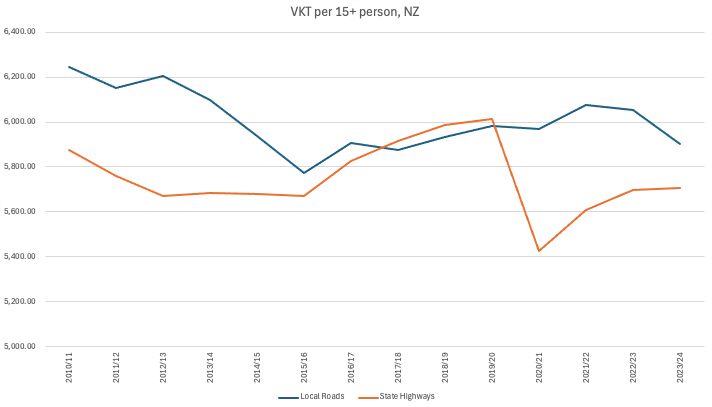
VKT per capita is worth a look too
Pulling the VTK (annual) and matching to the mid-period population, I get this. So same general vibe.
Great stuff. Thanks David
Motorcycles per capita is flat, or another way of putting it is stopped they increasing in 2023.


Fully a third of the population can’t or don’t drive: too old, too young, too poor, too ill, don’t wanna. These people are excluded from society and the economy by most transport thinking. Including Barry’s.