avatar
✨StarChick68💫 @starchick68.bsky.social

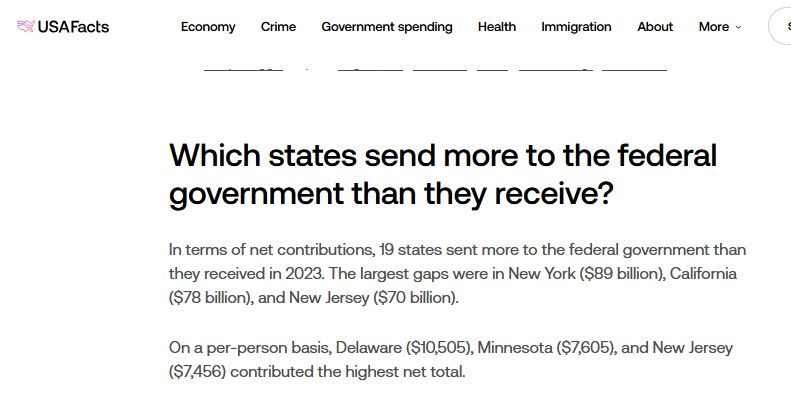
usafacts.org/articles/whi...

screenshot of text, more on link: Which states send more to the federal government than they receive? In terms of net contributions, 19 states sent more to the federal government than they received in 2023. The largest gaps were in New York ($89 billion), California ($78 billion), and New Jersey ($70 billion). On a per-person basis, Delaware ($10,505), Minnesota ($7,605), and New Jersey ($7,456) contributed the highest net total. https://usafacts.org/articles/which-states-contribute-the-most-and-least-to-federal-revenue/
aug 31, 2025, 4:48 am • 0 0

Replies

avatar
✨StarChick68💫 @starchick68.bsky.social

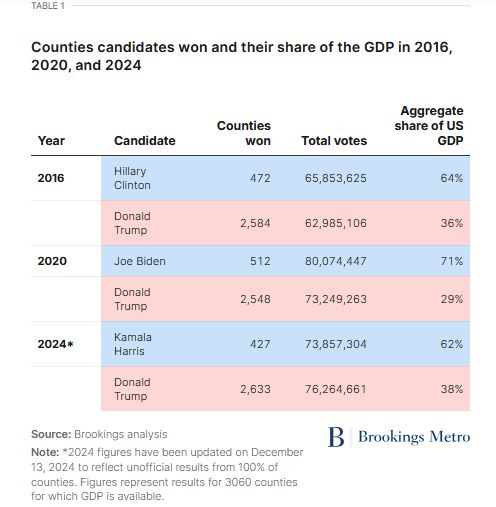
Counties candidates won and their share of the GDP in 2016, 2020, and 2024 www.brookings.edu/articles/tru...

screenshot of table of data (summarized in text of article ... see link) In 2016, Brookings research reported that the 2,584 mostly small town and rural counties that powered Trump into the presidency generated just 36% of the country’s GDP, meaning red America would govern the U.S. economy as an economic minority. A similar analysis of the 2020 vote showed an even sharper economic divide, with Trump’s now-losing base in 2,564 counties representing just 29% of the GDP, compared to the 71% share in the 520 mostly urban counties won by President Joe Biden. Now, in 2024, the story of red America’s minority status as an economic power continues unabated, albeit with unmistakable gains. This year, Brookings calculations suggest that President-elect Donald Trump’s winning base in 2,633 counties represents 86% of the nation’s total counties but just 38% of the nation’s GDP. Conversely, Vice President Kamala Harris’ losing base of 427 much higher-output counties represents 62% of the GDP. Table 1 Counties candidates won and their share of the GDP in 2016, 2020, and 2024 Table with 5 columns and 6 rows. 2016 Hillary Clinton 472 65,853,625 64% Donald Trump 2,584 62,985,106 36% 2020 Joe Biden 512 80,074,447 71% Donald Trump 2,548 73,249,263 29% 2024* Kamala Harris 427 73,857,304 62% Donald Trump 2,633 76,264,661 38% Source: Brookings analysis Note: *2024 figures have been updated on December 13, 2024 to reflect unofficial results from 100% of counties. Figures represent results for 3060 counties for which GDP is available. https://www.brookings.edu/articles/trump-again-won-counties-representing-a-minority-share-of-national-gdp-but-with-notable-gains/
aug 31, 2025, 4:48 am • 2 1 • view