avatar
Lukas Brunner @lukasbrunner.bsky.social

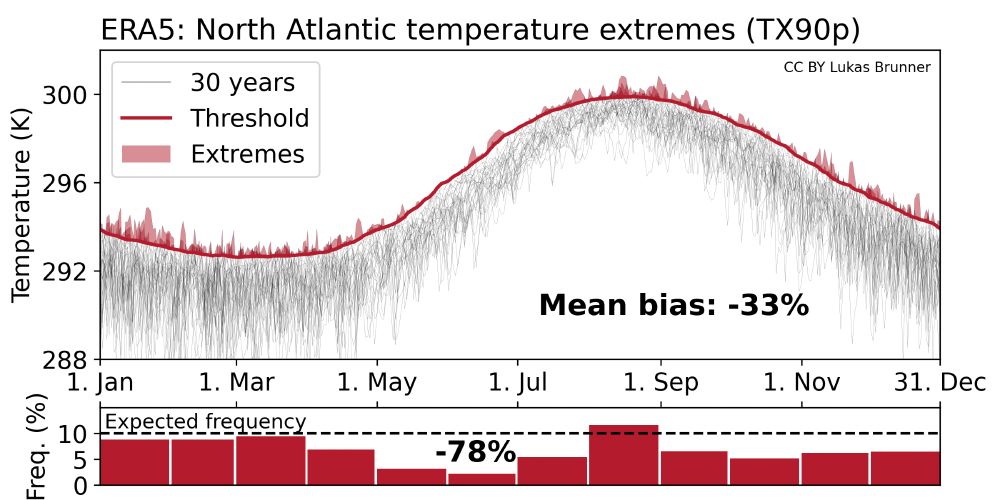
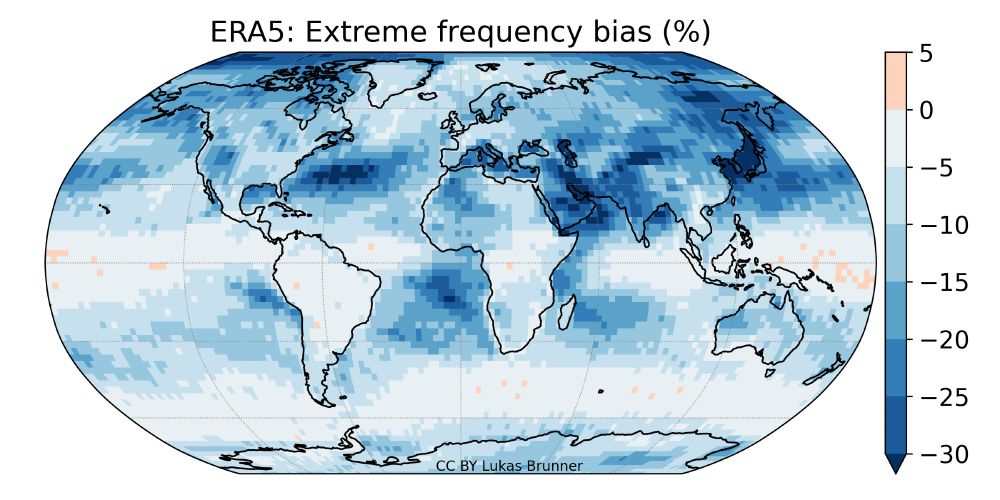
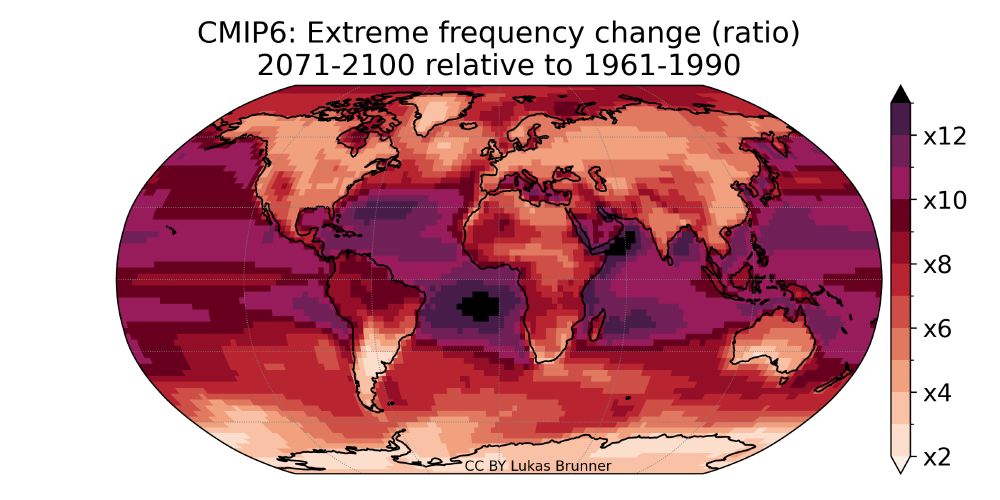
🚨 New paper in @NatureComms We show that relative temperature extremes (TX90p) as used in many studies can be biased by as much as 50%! The bias arises from the use of too long seasonal windows and can easily be corrected. Details below 1/🧡 doi.org/10.1038/s414... πŸ§ͺ

mar 19, 2024, 12:29 pm β€’ 17 9

Replies

avatar
Lukas Brunner @lukasbrunner.bsky.social

TX90p is defined relative to the TX 90th percentile at each location & across the seasonal cycle. (Implicit) assumption: ~10% of days are extreme (in sample) regardless of region and season. We show that this assumption often does not hold and discuss implications. 2/🧡

Figure showing the seasonal cycle of maximum temperature in the North Atlantic as well as the instances when temperature exceeds the 90th percentile threshold. In the bottom part, the mean frequency per month is shown. In most months the frequency deviates clearly from the expected 10%.
mar 19, 2024, 12:30 pm β€’ 0 0 β€’ view
avatar
Lukas Brunner @lukasbrunner.bsky.social

Running seasonal windows are often used to increase the sample size for the percentile calculation. Many studies use 15- or even 31-day windows, inadvertently mixing seasonal gradients into the threshold. As a result, the extreme frequency is systematically biased low! 3/🧡

Figure showcasing how the interaction between a 31-day running window and the seasonal gradients leads to a 90th percentile extreme threshold that is not exceeded by a single value.
mar 19, 2024, 12:31 pm β€’ 0 0 β€’ view
avatar
Lukas Brunner @lukasbrunner.bsky.social

Since the seasonal cycle varies across the globe, so does the bias. In some regions, the annual extreme frequency is close to the expected 10%, and in others only 5% (-50% bias). This undermines a fair comparison of extremes and derived heatwave metrics between regions. 4/🧡

Figure showing a global map of extreme temperature bias.
mar 19, 2024, 12:32 pm β€’ 0 0 β€’ view
avatar
Lukas Brunner @lukasbrunner.bsky.social

The bias weakens with global warming (see paper for details rdcu.be/dBByU) leading to an overestimation of temperature extreme changes. 10% expected baseline frequency -> max. increase x10 -> 100% extremes in the future. In the biased case πŸ‘‡ the ratio can exceed x13! 5/🧡

Figure showing a global map of temperature extreme changes between 1961-1990 and 2071-2100 as the ratio between future and past.
mar 19, 2024, 12:33 pm β€’ 0 0 β€’ view
avatar
Lukas Brunner @lukasbrunner.bsky.social

Derived metrics such as heatwaves are also affected. We show that the bias also impacts changes in land heatwaves during the warm season as a more impact-focused metric πŸ‘‡πŸ‘‡ 6/🧡

Figure showing a global map of summer land heatwave changes between 1961-1990 and 2071-2100.
mar 19, 2024, 12:33 pm β€’ 1 0 β€’ view
avatar
Lukas Brunner @lukasbrunner.bsky.social

How to eliminate the bias? Only using short windows also comes with problems (see paper for a discussion). We propose to remove the mean seasonal cycle before the percentile calculation. Result: the bias is all but gone πŸ’ͺ 7/🧡

Figure showing a global map of extreme temperature bias after applying the bias correction mentioned in the tweet. The bias is limited to less than 5% for this case.
mar 19, 2024, 12:34 pm β€’ 0 0 β€’ view
avatar
Lukas Brunner @lukasbrunner.bsky.social

Conclusion: don’t use long seasonal windows in the calculation of extreme threshold without correction! The bias might not obviously show in derived metrics but could still lead to πŸ‘‰ Pitfalls in diagnosing temperature extremes πŸ‘ˆ 8/🧡 doi.org/10.1038/s414...

mar 19, 2024, 12:34 pm β€’ 0 0 β€’ view
avatar
Lukas Brunner @lukasbrunner.bsky.social

What about problems in already published results? We focus on the methodological error and its *potential* implications - not on errors in individual studies. For many studies, the impact might be small as other factors dominate but we encourage people to check! 9/🧡

Screenshot of paper text, reading:
mar 19, 2024, 12:35 pm β€’ 0 0 β€’ view
avatar
Lukas Brunner @lukasbrunner.bsky.social

Many thanks to my co-author Aiko Voigt (@aikovoigt.bsky.social), and to Erich Fischer (@erichfischer.bsky.social) and Gabi Hegerl for their input! Thanks also for the helpful comments from three anonymous reviewers and the editor Efi Rousi (@efou.bsky.social) ! πŸ™πŸ™πŸ™ 10/🧡

mar 19, 2024, 12:39 pm β€’ 0 0 β€’ view
avatar
Lukas Brunner @lukasbrunner.bsky.social

We have made the code used in the study free to use: github.com/lukasbrunner... Example data are here: doi.org/10.5281/zeno... #openaccess #openscience 🧡/END

mar 19, 2024, 12:39 pm β€’ 0 0 β€’ view