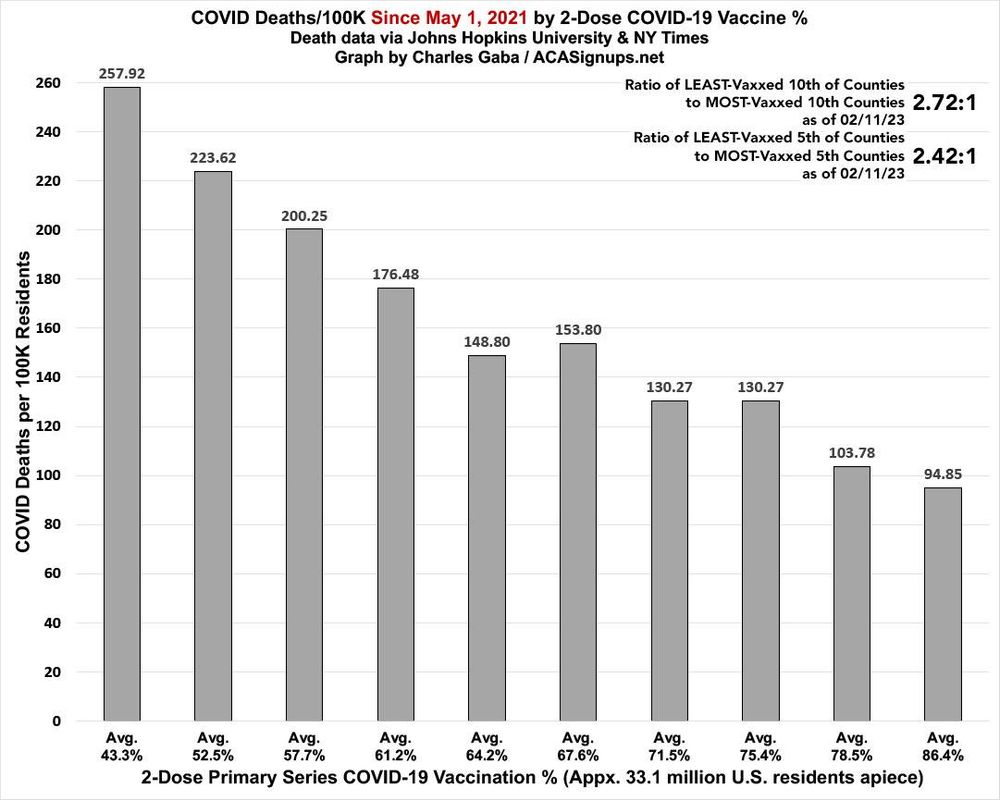
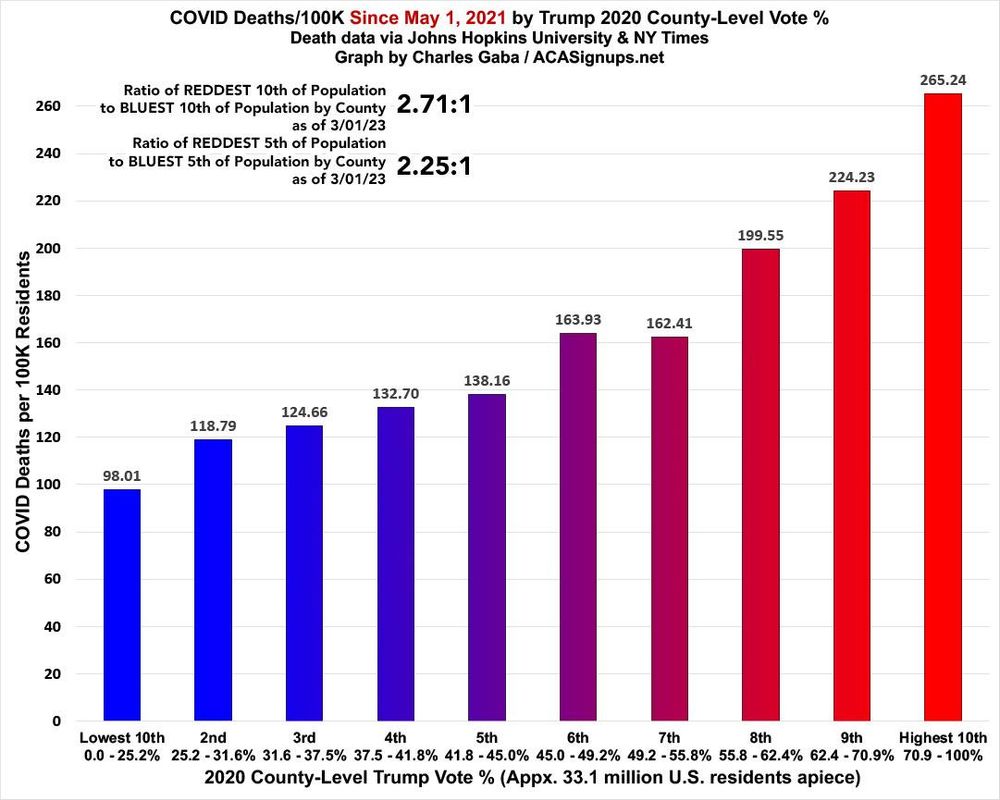
As @statman-stu.bsky.social reminds me, THIS is probably the single most important graph I’ve ever created. If you don’t mind my saying so, in one image it crystallizes everything wrong with America today.
The world would have been so much different if COVID had hit Republican areas first
In April, an average of about 350 people died each week from COVID, according to data from the Centers for Disease Control and Prevention (CDC). in Jan it was nearly 1000 a week. now it is way down. unless newer deadlier variant comes out most who would have died have covid.cdc.gov/covid-data-t...
ok, I see this is a thread and you have that info up top. i think most people who will die of covid will be those who age into the risk factors of dying from it. that is unless as I said a newer deadlier variant comes along in which case we all might be screwed as CDC will slow walk new vaccines
Really hate to bring Darwin into this situation but it's unavoidable at this point.
I liked the County graphic data, even better. It shows how profound the correlation is based upon just one variable, vax rate. It should be impossible to see this on a nationwide basis, given the many potential factors, yet there it is… bsky.app/profile/stat...
I was going to say something about this, but decided not to.. I don't want to regret being so blunt. But I'm certain I'm not the only one who had my thought..