avatar
Doug Johnson 🇨🇦🇺🇦🌦️🏞 @smikooman.bsky.social

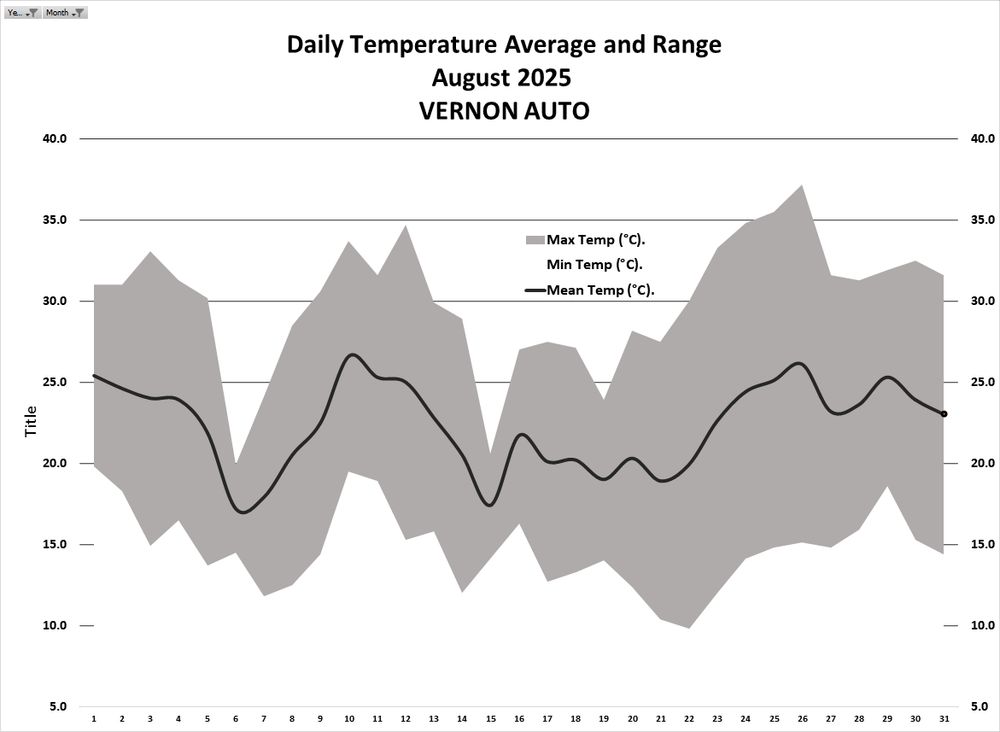
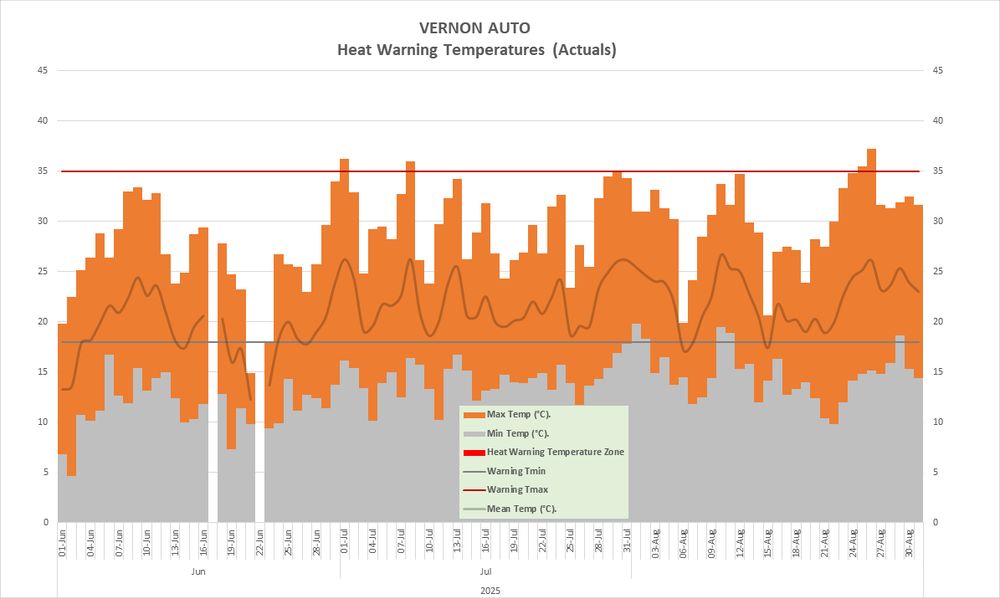
#VernonBC August 2025 Temperature Summary Vernon was 3.5°C warmer than normal. ➡️Average: 22.3°C (Normal: 18.8°C) ➡️Maximum: 37.2°C (Normal: 26.3°C; Extreme: 37.8°C) ➡️Minimum: 9.8°C (Normal: 11.3°C; Extreme: -1.7°C) Tmax records were broken in the heat wave centred around 25 Aug.

Time series of Vernon BC temperature over the month.
sep 1, 2025, 4:29 pm • 1 0

Replies

avatar
Doug Johnson 🇨🇦🇺🇦🌦️🏞 @smikooman.bsky.social

#VernonBC Aug 2025 Precipitation Summary ➡️Total Precip (mm): 12.6 mm ➡️This is 32% of the climatological reference normal (39.5 mm) ➡️Precipitation was -26.9 mm less than the climatological reference normal 12.6 mm of precipitation is typical of desert-like conditions.

Vernon BC precipitation by day of month. Vernon BC cumulative precipitation traces. Aug 2025 trace in blue. Years back to 1900 in grey.
sep 1, 2025, 4:29 pm • 0 0 • view
avatar
Doug Johnson 🇨🇦🇺🇦🌦️🏞 @smikooman.bsky.social

#VernonBC 2025 Climate Variance (1/2) Monthly temperature (l) and precipitation (r) compared to the 1961-1990 climatological reference normals. The year's above normal temperature trend continues (Feb excepted); long term drought conditions continue.

Chart of temperature variance from the 1961-1990 climatological reference normal. Chart of precipitation variance from the 1961-1990 climatological reference normal. Vertical scale is in mm and text label is percent of normal.
sep 1, 2025, 4:29 pm • 0 0 • view
avatar
Doug Johnson 🇨🇦🇺🇦🌦️🏞 @smikooman.bsky.social

#VernonBC 2025 Climate Variance (2/2) - Ranking ➡️ The mean daily temperature was 21.7°C, the 2th warmest on record (l) 🤒 ➡️ The total precipitation was 12.6 mm, the 25th driest on record (r) These figures are depicted in the charts as absolute variance from the climatological reference normal.

Monthly mean daily temperature variance (°C) from the 1961-1990 climatological reference normal average (18.8°C), for the entire station record (>100 years) Monthly mean daily precipitation variance (mm) from the 1961-1990 climatological reference normal average (39.5 mm),for the entire station record (>100 years)
sep 1, 2025, 4:29 pm • 0 0 • view
avatar
Doug Johnson 🇨🇦🇺🇦🌦️🏞 @smikooman.bsky.social

Meteorological Service of Canada Heat Warnings Heat warning criteria were NOT met this month, nor this summer at all! There were no periods when 2+ consecutive days of Tmax were 35°C or warmer and nighttime Tmin were 18°C or warmer.

The chart for Summer 2025 depicts days (red bars) where the daily high (≥ 35°C) and overnight low (≥ 18°C) meet the warning criteria. These criteria are also depicted as red and grey horizontal lines on the chart.
sep 1, 2025, 4:29 pm • 0 0 • view
avatar
Doug Johnson 🇨🇦🇺🇦🌦️🏞 @smikooman.bsky.social

#VernonBC 2025 Drought Watch Apr-Aug precipitation is 57% of cumulative normals; 109 mm actual vs. 191 mm normally.

Spaghetti plot of cumulative precipitation in Vernon B.C., April to June. Cumulative totals are 57% of normal.
sep 1, 2025, 4:29 pm • 0 0 • view
avatar
Doug Johnson 🇨🇦🇺🇦🌦️🏞 @smikooman.bsky.social

Data Credit Reference: climate.weather.gc.ca. I apply unadjusted data from three Vernon weather stations operational for over 100 years. Monthly valid data criteria: Monthly temperatures 90+% valid, precipitation 100% valid.

Vernon climate data sources
sep 1, 2025, 4:29 pm • 1 0 • view