avatar
Climate Central @climatecentral.org

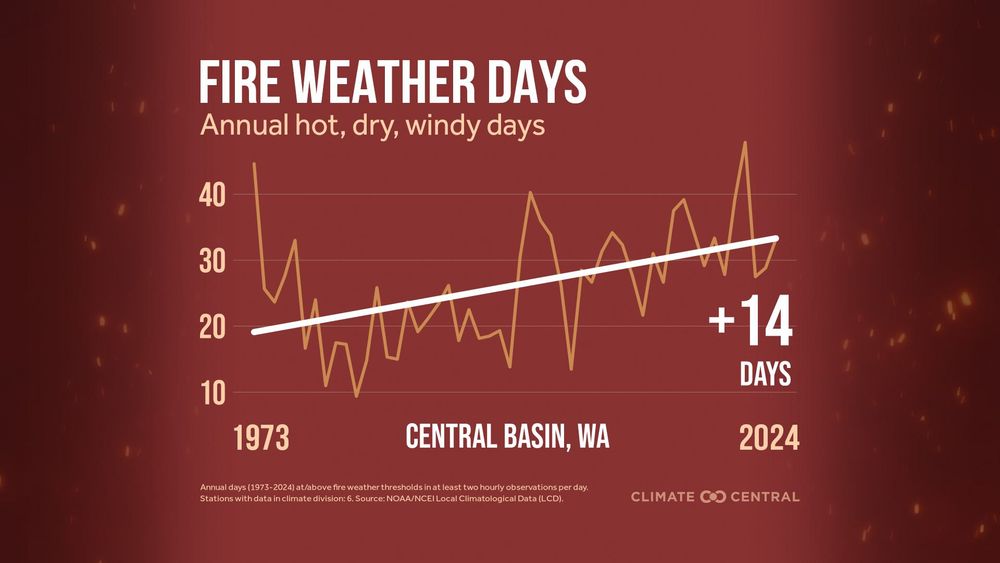
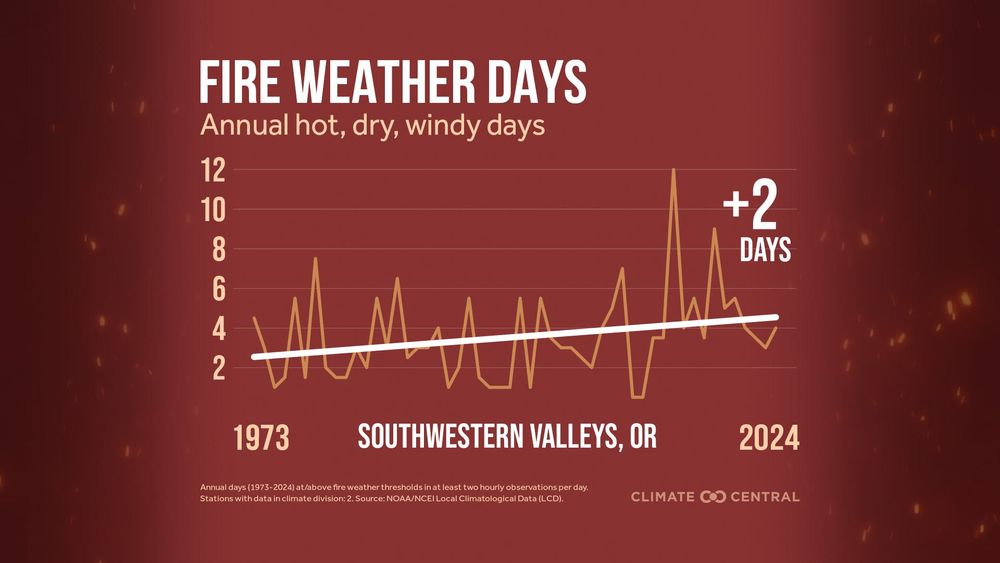
Zooming out: Fire weather days like today -- hot, dry & windy -- have become more common across the Pacific Northwest. Wildfire seasons are getting longer and more intense. Climate change may not spark the flames, but it creates conditions that make them more likely to spread

Line chart showing annual fire weather days (hot, dry, windy) in Central Basin, WA, from 1973–2024. Trend increases by +14 days over time. Source: NOAA/NCEI LCD ine chart showing annual fire weather days in Southwestern Valleys, OR, from 1973–2024. Trend increases by +2 days. Source: NOAA/NCEI LCD Line chart showing annual fire weather days in South Central, OR, from 1973–2024. Trend increases by +23 days. Source: NOAA/NCEI LCD
sep 2, 2025, 9:46 pm • 1 1

Replies

avatar
Climate Central @climatecentral.org

The staying power of this heat has also become more common over the decades. Multi-day extreme heat streaks: • Strain power grids ⚡ • Worsen air quality 🌫️ • Put people at risk for heat-related illness 🥵

Bar chart showing average annual extreme heat streaks in Bend, OR (3+ days at 85°F+). About 4 streaks per year in the 1970s–1990s, rising to about 5 in the 2000s–2020s. Source: NOAA/ACIS. Bar chart showing average annual extreme heat streaks in Yakima, WA (3+ days at 90°F+). About 4 streaks per year in the 1970s–1990s, rising to 5 in the 2000s, 6 in the 2010s, then 5 in 2020–24. Source: NOAA/ACIS Bar chart showing average annual extreme heat streaks in Spokane, WA (3+ days at 86°F+). About 3–4 streaks per year from the 1970s–2010s, rising sharply to 6 streaks in 2020–24. Source: NOAA/ACIS
sep 2, 2025, 9:46 pm • 4 2 • view
avatar
Climate Central @climatecentral.org

📊RESOURCES: • Climate Shift Index | csi.climatecentral.org • More Frequent Fire Weather | www.climatecentral.org/climate-matt... • Extreme Heat Streaks | www.climatecentral.org/climate-matt...

sep 2, 2025, 9:46 pm • 3 1 • view