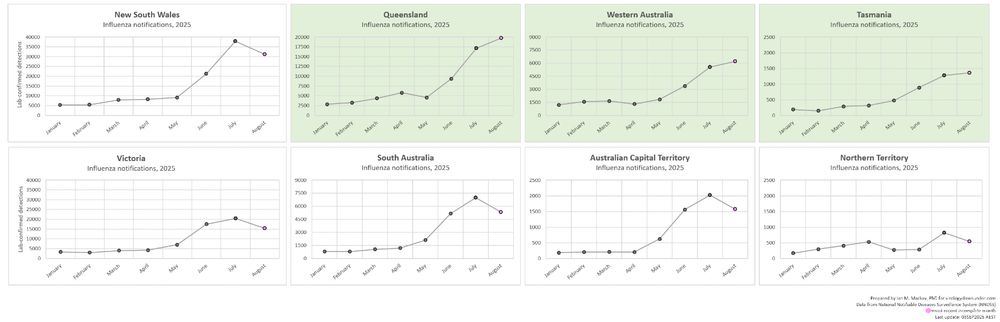
Case detections by jurisdiction & month. Pink dot at the end of a line is for this ongoing month. NSW slowing is impacting national tally the most (biggest "producer" & highest rate of detections). QLD, WA & TAS (green) peaed in August. These buck the national trend of a July peak.