
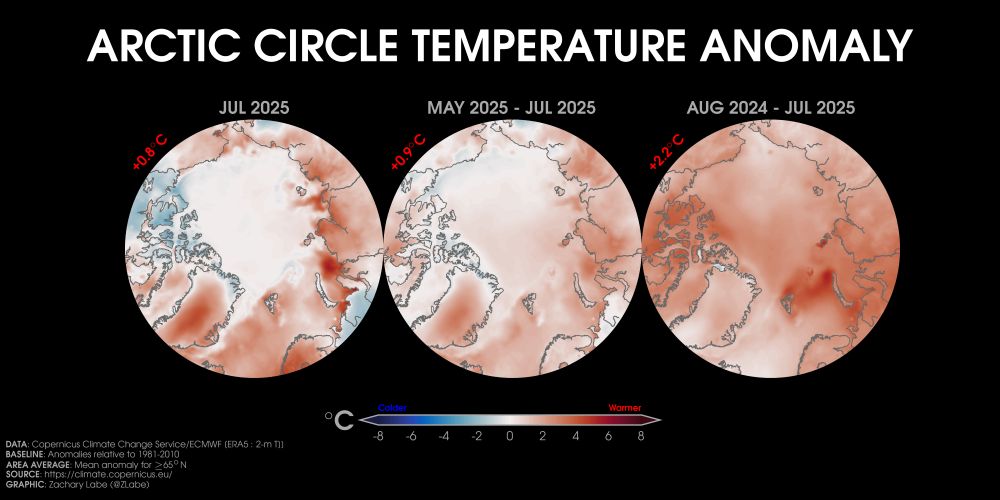
Maps of temperature departures averaged over the last month (left), 3 months (center), and 12 months (right) across the #Arctic... Data available from doi.org/10.24381/cds...
Maps of temperature departures averaged over the last month (left), 3 months (center), and 12 months (right) across the #Arctic... Data available from doi.org/10.24381/cds...

I'm a little confused about why sea ice isn't tanking to all-time lows right now.