
Zack Labe
@zacklabe.com
Climate Scientist at @climatecentral.org | PhD | Passionate about improving science communication through data-driven stories | Harrisburg, PA | https://zacklabe.com/ Views, thoughts, and opinions expressed here are only my own.
created May 27, 2023
40,640 followers 1,004 following 3,502 posts
view profile on Bluesky Posts
 Zack Labe (@zacklabe.com)
August 2025 #Arctic sea ice extent was the 7th lowest on record for the month... This was 1,790,000 km² below the 1981-2010 average. August ice extent is decreasing at about 9.79% per decade. Data: nsidc.org/data/seaice_...
 Zack Labe (@zacklabe.com)
A tremendous amount of science and societal progress is going out the window fast, *AI included.* Another daily tragedy. ➡️ We need you to spread the word outside of our science bubble. "NSF terminates funding for its main meteorology focused AI institute" open.substack.com/pub/balanced...
 Zack Labe (@zacklabe.com)
September observes the largest losses of #Arctic sea ice concentration compared to any other month of the year. And NO increases. The largest declines are in parts of the Chukchi and Beaufort Seas. Sea ice concentration = fraction of ice-cover. More info: doi.org/10.1175/BAMS...
 Zack Labe (@zacklabe.com)
I've now started to include the monthly mean maps of Arctic (zacklabe.com/arctic-sea-i...) and Antarctic (zacklabe.com/antarctic-se...) sea-ice concentration to my pages for download. Reminder to click on my graphics for a high-resolution copy. Hope this is useful! 🙂
 Zack Labe (@zacklabe.com) reply parent
I'm simply showing the decadal averages.
 Zack Labe (@zacklabe.com)
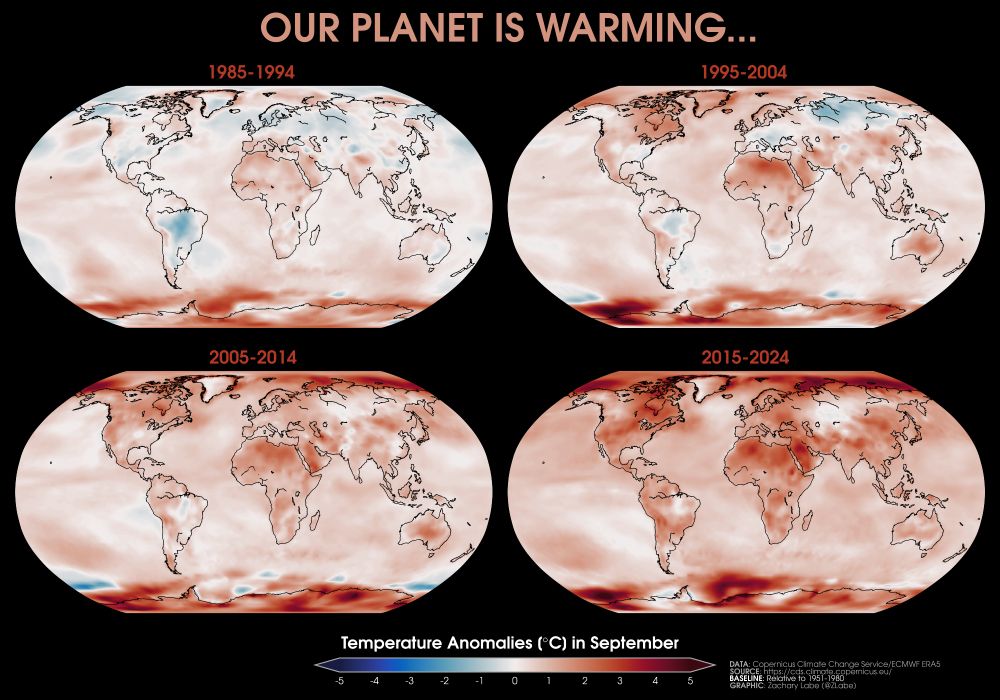
Happy start to meteorological fall! We are finally getting into my favorite time of year (fall and winter). Here's a look at the warming of global temperatures during the last four decades in the month of September. 🎃 Data from doi.org/10.24381/cds...
 Zack Labe (@zacklabe.com) reply parent
Thank you! I use Python's @matplotlib.org (zacklabe.com/methods-and-...)
 Zack Labe (@zacklabe.com)
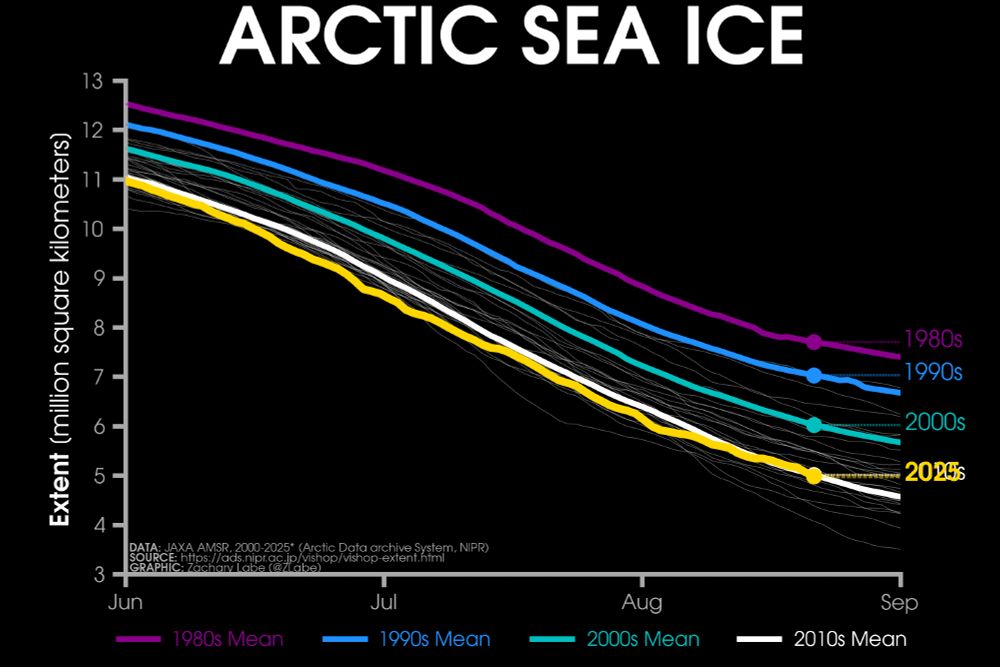
Monday ice update - #Arctic sea ice extent is currently the 10th lowest on record (JAXA data) • about 90,000 km² above the 2010s mean • about 1,010,000 km² below the 2000s mean • about 2,010,000 km² below the 1990s mean • about 2,740,000 km² below the 1980s mean More: zacklabe.com/arctic-sea-i...
 Zack Labe (@zacklabe.com) reply parent
😁
 Zack Labe (@zacklabe.com) reply parent
Thank you for joining!
 Zack Labe (@zacklabe.com)
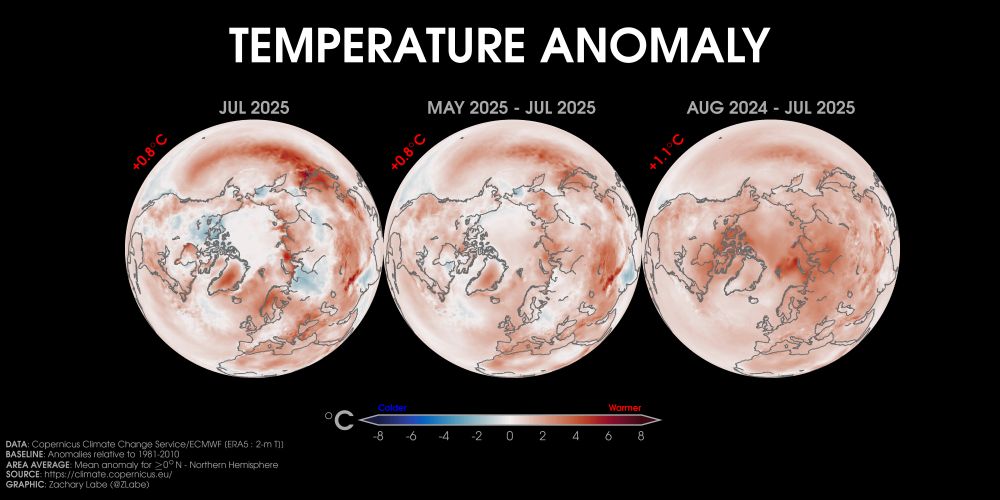
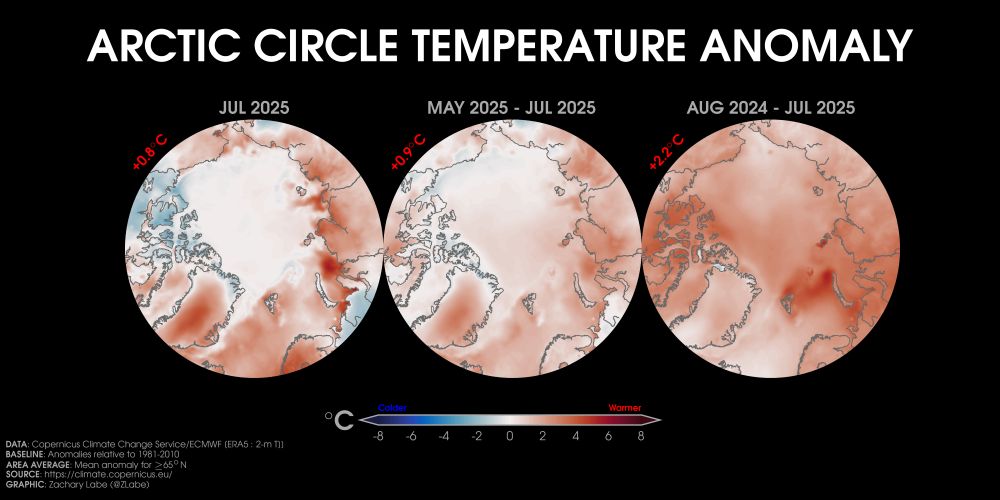
Temperature anomalies averaged over the last month (left), 3 months (center), and 12 months (right) across the Northern Hemisphere... Data from @copernicusecmwf.bsky.social ERA5 reanalysis.
 Alan Gerard (@wxmanms1.bsky.social) reposted
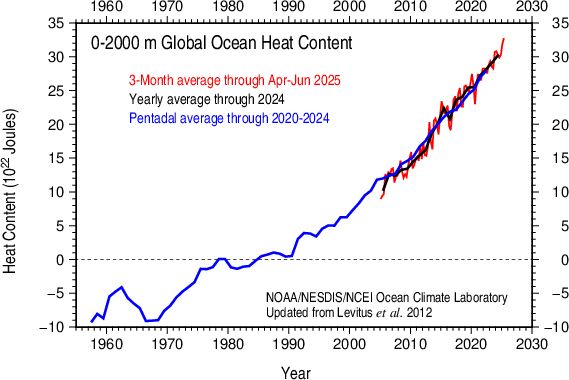
Took Zack's post as a sign to do a deep dive into some of the potential implications of increased oceanic heat in the news just this week, including potential eventual AMOC/Gulf Stream breakdown and a current months long record heatwave in Japan. Yeah, it's not good, folks. tinyurl.com/5n7neztb
 Zack Labe (@zacklabe.com) reply parent
Yeah this graphic is incredibly confusing, but I haven't had the time to remake it myself. It's showing anomalies relative to 1955-2006.
 Zack Labe (@zacklabe.com)
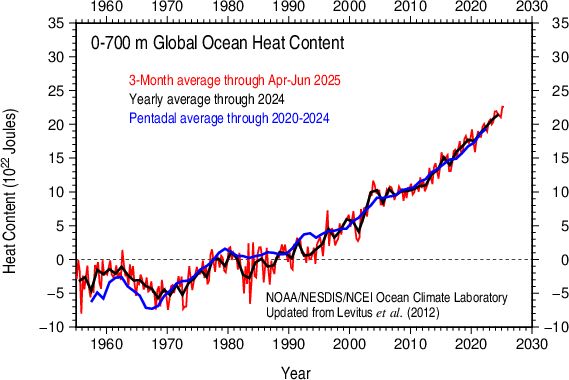
Upper ocean heat content (0 to 700 m depth) also set a new record high with the latest June data update (see my earlier post). Yikes! 🌊 Graphic/data (anomalies) from www.ncei.noaa.gov/access/globa...
 Zack Labe (@zacklabe.com) reply parent
Thank you!
 Zack Labe (@zacklabe.com) reply parent
 Zack Labe (@zacklabe.com) reply parent
Lol, whoops! Apparently too frequently used to writing that for sea ice.
 Zack Labe (@zacklabe.com) reply parent
See doi.org/10.1175/JCLI...
 Zack Labe (@zacklabe.com) reply parent
See Figure 2 in doi.org/10.1038/s415...
 Zack Labe (@zacklabe.com)
Meanwhile, back in reality, global ocean heat content just updated through June 2025 and set a new record high. Time to wake up! Data (anomalies) & methods from www.ncei.noaa.gov/access/globa...
 Zack Labe (@zacklabe.com) reply parent
Thanks! :)
 Zack Labe (@zacklabe.com) reply parent
🤪
 Zack Labe (@zacklabe.com)
The size of the current global sea-ice volume departure is near record levels, with thinner than average ice found in both the #Arctic and #Antarctic. Graphic from zacklabe.com/global-sea-i...
 Zack Labe (@zacklabe.com)
Our oceans are warming. Here is a look at the globally averaged sea surface temperature over the last three months relative to each May-June-July period since 1854. Data from NOAA ERSSTv5: www.ncei.noaa.gov/products/ext... 🌊
 Zack Labe (@zacklabe.com) reply parent
I was wondering this too! Any update @the-iceman.bsky.social?
 Zack Labe (@zacklabe.com)
More sad news for the polar community... Arctic Research Consortium of the United States (@arcus-arctic.bsky.social) is shutting down. We all lose here. The past 8 months have been unthinkable, and their consequences for the future even more so.
 Zack Labe (@zacklabe.com)
100 years of average May-June-July temperature departures over land areas through 2025... Data from NOAAGlobalTemp v6.0.0: www.ncei.noaa.gov/products/lan...
 adam mahoney (he/him) (@adamlmahoney.bsky.social) reposted
NEW: Last week, oil literally rained down on a Black town in rural Louisiana where 60% of folks live in poverty. The company isn’t taking responsibility & the federal + state governments are saying residents have to clean it up themselves. capitalbnews.org/louisiana-oi...
 Zack Labe (@zacklabe.com) reply parent
Thank you!!
 Zack Labe (@zacklabe.com)
Friday ice update - #Arctic sea ice extent is currently the 10th lowest on record (JAXA data) • about 50,000 km² above the 2010s mean • about 1,040,000 km² below the 2000s mean • about 2,020,000 km² below the 1990s mean • about 2,760,000 km² below the 1980s mean More: zacklabe.com/arctic-sea-i...
 Zack Labe (@zacklabe.com) reply parent
Takeaway - In this model, lightning increases across the West in the near-future, with the largest change in risk for ignited wildfires across the Rockies.
 Zack Labe (@zacklabe.com)
✅ We have a new study out this week, which projects changes in cloud-to-ground (CG) lightning days across the Western United States, along with the associated risk of lightning-ignited wildfires (LIW). + #OpenAccess Paper (@agu.org): doi.org/10.1029/2025... + Summary: news.wsu.edu/press-releas...
 Zack Labe (@zacklabe.com) reply parent
Ocean areas in particular:
 Zack Labe (@zacklabe.com)
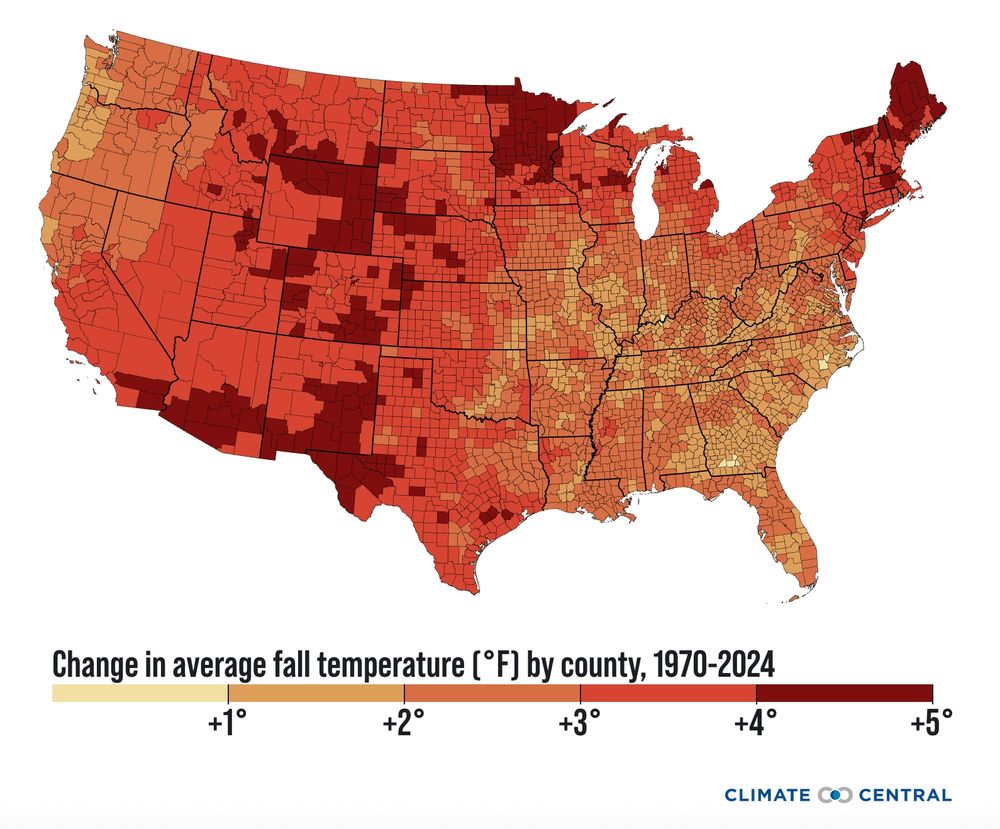
Temperatures have warmed across the entire contiguous United States over the last five decades or so during the months of September through November. Check out @climatecentral.org's fall package for more information and graphics: www.climatecentral.org/climate-matt... 🍁🍂
 American Meteorological Society (@ametsoc.org) reposted
New AMS statement outlines five foundational flaws that make the Department of Energy's Climate Synthesis Report "inconsistent with scientific principles and practices." Read the full statement: https://bit.ly/3UQRC82
 Zack Labe (@zacklabe.com) reply parent
Unfortunately that's outside of my area of research.
 Zack Labe (@zacklabe.com) reply parent
Congratulations!!
 Zack Labe (@zacklabe.com)
My climate change dashboard is updated for this month... Higher resolution graphic available at zacklabe.com/climate-chan... 🧪
 Meade Krosby (@meadekrosby.bsky.social) reposted
Three of nine regional Climate Adaptation Science Centers (CASCs) across the country will shut down by October if OMB continues to withhold funds to renew their 5-year cooperative agreements - which includes funds already appropriated to the CASCs by Congress for Fiscal Year 2025.
 Zack Labe (@zacklabe.com)
One way of visualizing the variability and multidecadal decline of July #Arctic sea-ice thickness and sea-ice volume through 2025... + Data information (PIOMAS): climatedataguide.ucar.edu/climate-data...
 Zack Labe (@zacklabe.com) reply parent
Yes! I have a few podcasts from this year listed here: zacklabe.com/media-and-ou...
 Zack Labe (@zacklabe.com)
The average global temperature anomaly for every May-July period since the year 1850. As expected, 2025 will not set a new record for the annual mean metric. Data provided by @noaa.gov NOAAGlobalTemp v6.0.0 (www.ncei.noaa.gov/products/lan...).
 Alan Gerard (@wxmanms1.bsky.social) reposted
Important weather science news tonight: NOAA has canceled procurement of the next phased array weather radar R&D instrument. Along with the obvious blow to PAR weather research, it is consistent with other moves by admin to push forward quickly with NOAA cuts. More: https://tinyurl.com/my8hx8j6
 Zack Labe (@zacklabe.com) reply parent
Awesome!
 Zack Labe (@zacklabe.com) reply parent
Some additional visuals here by @chriscmooney.bsky.social: reportearth.substack.com/p/insights-o...
 Zack Labe (@zacklabe.com)
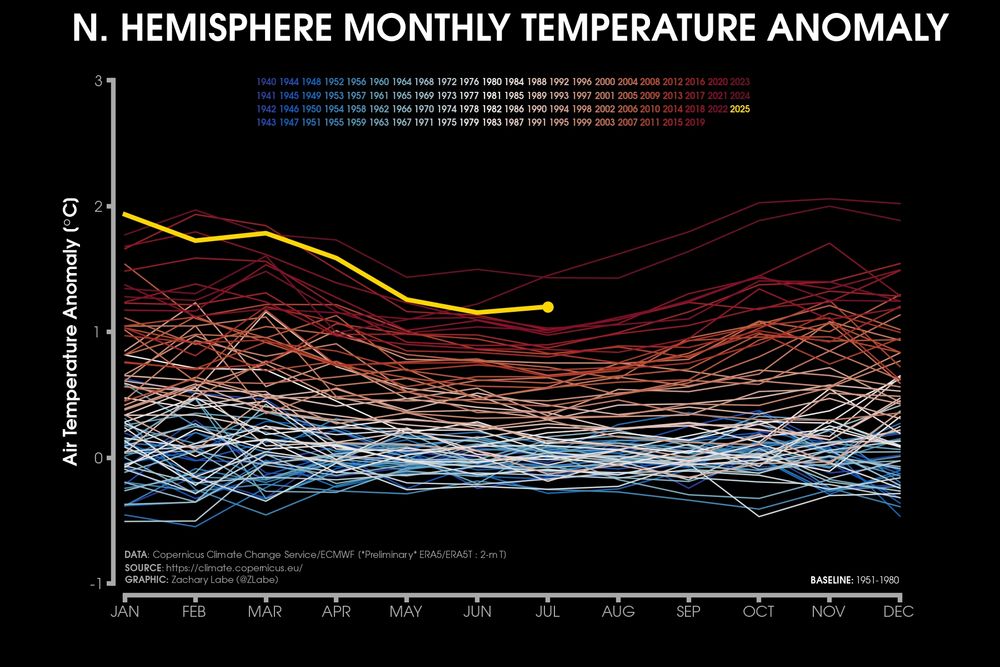
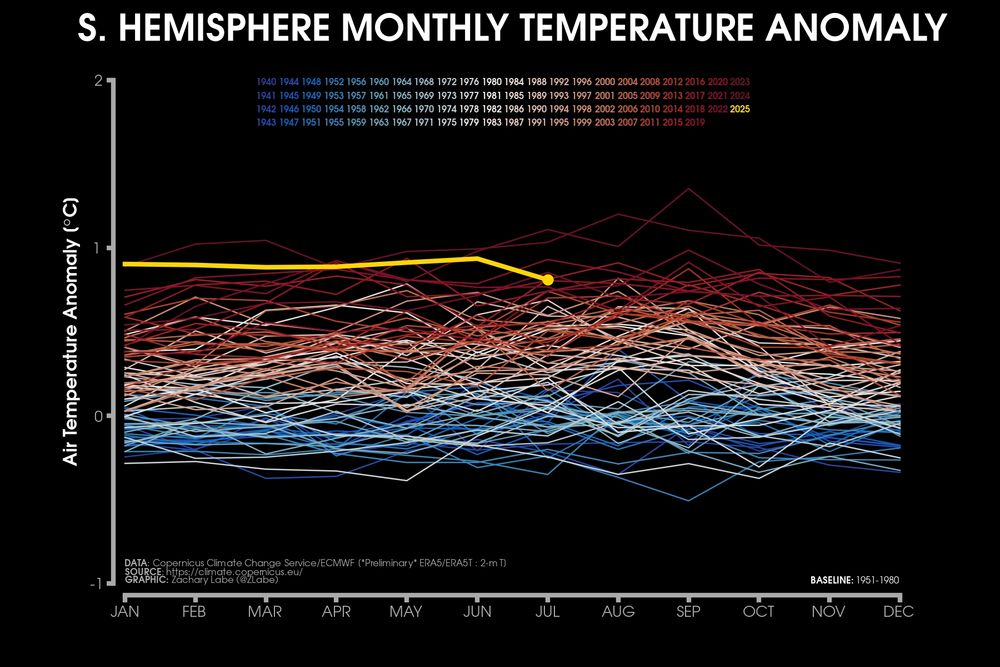
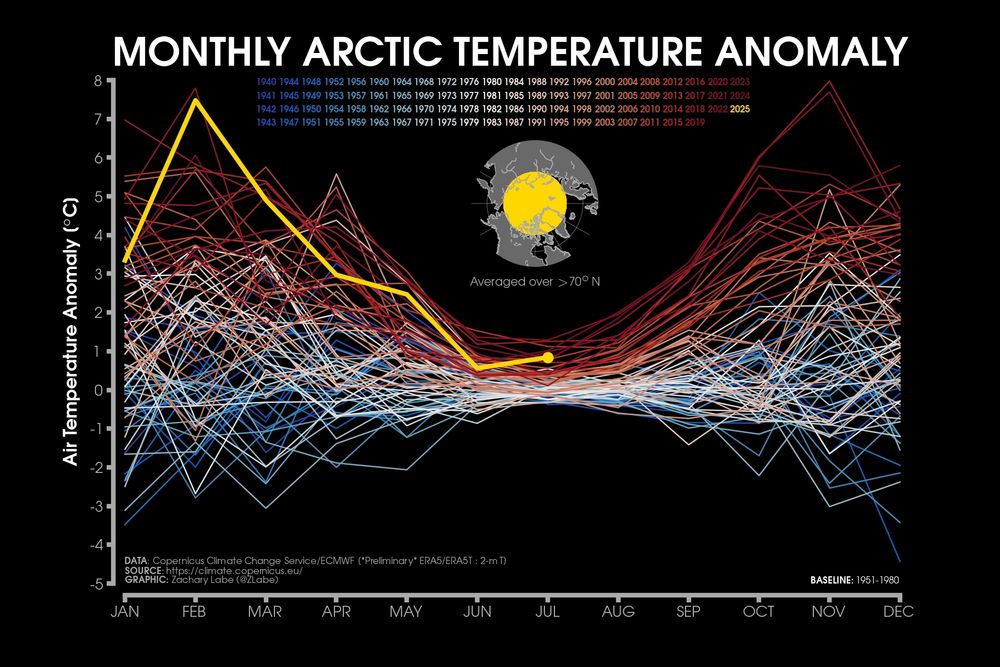
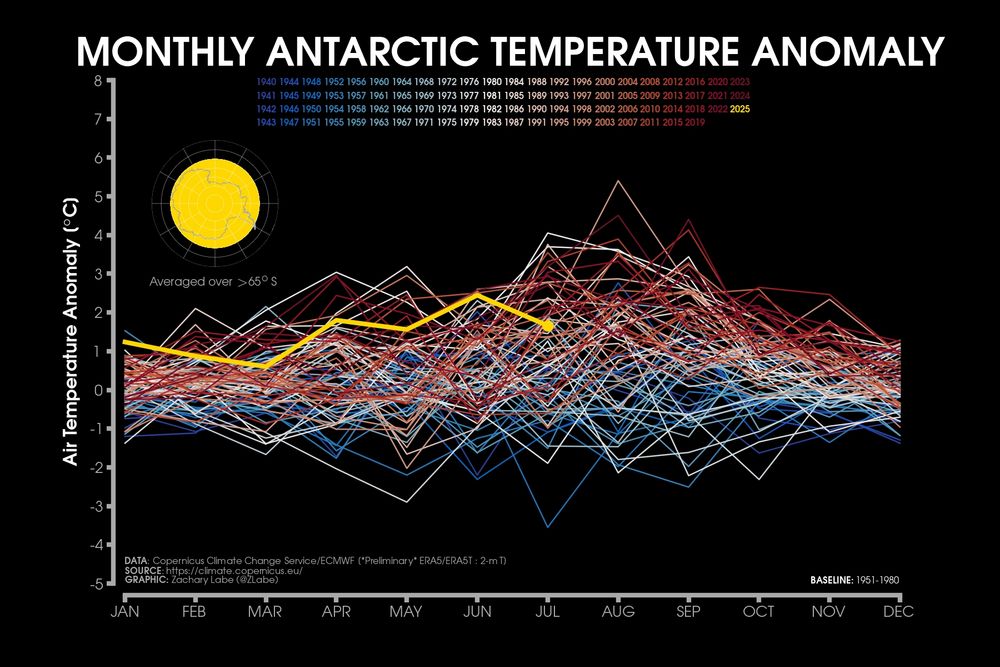
Comparing the different seasonality and trends in the magnitude of monthly temperature anomalies since 1940 for the Northern Hemisphere, Southern Hemisphere, Antarctic and Arctic. There are significant differences in the rate of long-term warming (blue to red lines). Data: doi.org/10.24381/cds...
 Zack Labe (@zacklabe.com)
Evolution of July #Arctic sea ice and sea surface temperature (SST) anomalies during the satellite-era... A summary of last month can be found from the @nsidc.bsky.social at nsidc.org/sea-ice-toda... *SST data set (OISSTv2.1) is only available since about 1982
 Zack Labe (@zacklabe.com)
"These cuts, which would hit basic science on the weather, oceans, and—especially—climate, represent a “down payment” on the White House’s proposal to eliminate NOAA’s research arm in the 2026 fiscal year that begins on 1 October, agency officials have told employees."
 Grist (@grist.org) reposted
Antarctica is in extreme peril. "Abrupt changes" threaten to send the continent past the point of no return, a new study finds. grist.org/climate/anta... #Climate #Ice #Antarctica #Environment #Heat #Science #Research #Study
 Zack Labe (@zacklabe.com)
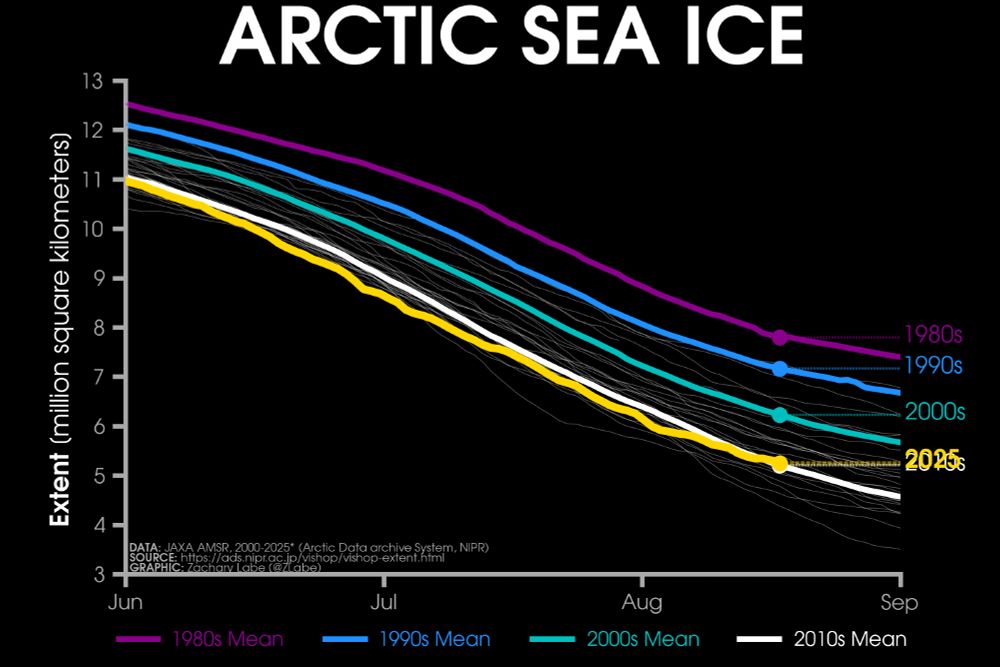
Monday ice update - #Arctic sea ice extent is currently the 9th lowest on record (JAXA data) 🌊🧪 • about 1,000 km² below the 2010s mean • about 1,050,000 km² below the 2000s mean • about 2,070,000 km² below the 1990s mean • about 2,760,000 km² below the 1980s mean More: zacklabe.com/arctic-sea-i...
 Zack Labe (@zacklabe.com) reply parent
I am sorry, but I don't know what you are referring to. Antarctic sea ice is currently the 2nd lowest on record: zacklabe.com/antarctic-se...
 Zack Labe (@zacklabe.com)
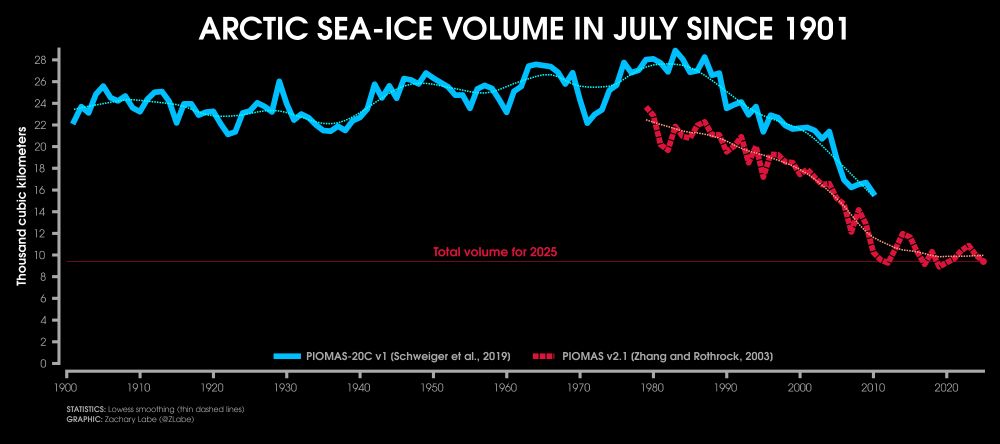
Modeled reconstruction of July #Arctic sea ice volume since the year 1901 - comparison between PIOMAS-20C and PIOMAS data sets now updated through 2025... Data information available at doi.org/10.1175/JCLI...
 Zack Labe (@zacklabe.com) reply parent
Thank you! :)
 Zack Labe (@zacklabe.com)
“The Office of Management and Budget approved a fiscal 2025 spending plan for the National Oceanic and Atmospheric Administration that would claw back remaining funds at most of the agency’s line offices.”
 Zack Labe (@zacklabe.com)
Temperatures over global land areas so far this year are still the 2nd warmest on record (after last year)... 🫥 Data from www.ncei.noaa.gov/products/lan...
 Zack Labe (@zacklabe.com)
I have a new 'climate viz of the month' blog posted, which looks at the regional differences in days with open water across the #Arctic: zacklabe.com/climate-viz-... #SciComm #DataViz #OpenScience #OpenData #ClimateChange
 Zack Labe (@zacklabe.com) reply parent
Most of the recent global sea ice records are due to the sudden loss in Antarctic sea ice since 2016.
 Zack Labe (@zacklabe.com)
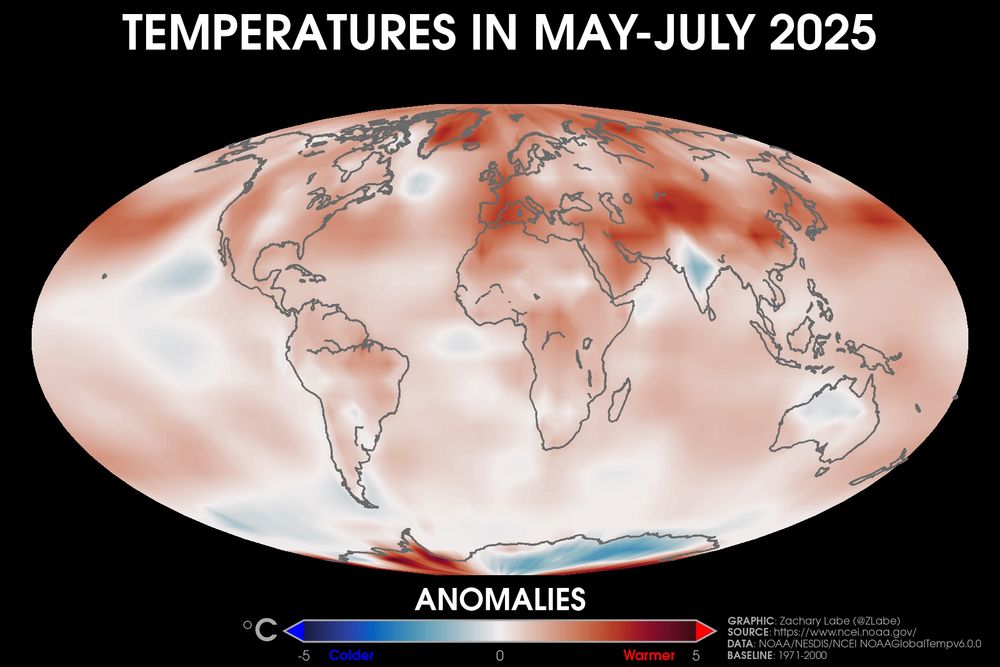
Looking back at some temperature departures averaged over the last three months (May-June-July) - what's it like in your backyard? 🟥 [red] warmer than average 🟦 [blue] colder than average Dataset (NOAAGlobalTempv6) described in doi.org/10.1175/BAMS....
 Zack Labe (@zacklabe.com) reply parent
Yep! Check this study out: doi.org/10.1126/scia...
 Zack Labe (@zacklabe.com) reply parent
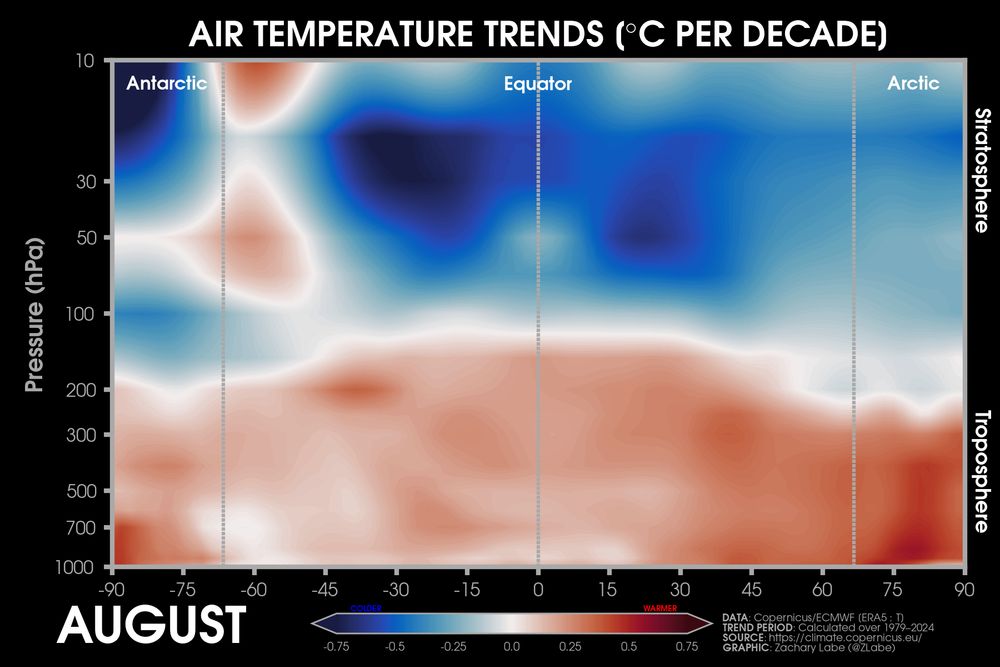
This is calculating the trend (slope) from 1979 to 2024 (°C per year) and then converting the units to per decade by multiplying by 10.
 Zack Labe (@zacklabe.com) reply parent
This is just due to very large variability (atmospheric noise)... not statistically significant in this case.
 Zack Labe (@zacklabe.com)
Vertical cross-sections of temperature trends in the lower atmosphere during the month of August. The bottom of the y-axis is the lower troposphere, and the upper portion is reaching into the stratosphere. Data is provided by @copernicusecmwf.bsky.social ERA5 reanalysis.
 Zack Labe (@zacklabe.com)
July 2025 data is now available for both Antarctic sea-ice thickness/volume (zacklabe.com/antarctic-se...) and global sea-ice volume (zacklabe.com/global-sea-i...) from GIOMAS. Last month's global sea-ice volume has fallen to a record low for the month of July in this dataset. #SciComm #DataViz
 Zack Labe (@zacklabe.com) reply parent
Check out this work around the early/mid-20th century warming: doi.org/10.1002/wcc....
 Zack Labe (@zacklabe.com)
100 years of changing August sea ice... Total data set available from 1850 through 2017. Summary of methods: carbonbrief.org/guest-post-p...
 Zack Labe (@zacklabe.com) reply parent
I don't know what to call it haha.
 Zack Labe (@zacklabe.com)
Lol, wild stuff in the latest paper sent by people trolling climate change misinformation.
 Zack Labe (@zacklabe.com)
Friday ice update - #Arctic sea ice extent is currently the 7th lowest on record (JAXA data) 🌊 • about 30,000 km² below the 2010s mean • about 1,040,000 km² below the 2000s mean • about 2,050,000 km² below the 1990s mean • about 2,720,000 km² below the 1980s mean More: zacklabe.com/arctic-sea-i...
 Zack Labe (@zacklabe.com) reply parent
I mean this map:
 Zack Labe (@zacklabe.com)
Last month observed a large amount of regional variability in the pattern of temperature anomalies across #Antarctica. These areas matched the location of the difference sea-ice concentration departures pretty closely as well. Data from @copernicusecmwf.bsky.social ERA5 reanalysis.
 Zack Labe (@zacklabe.com)
Differences in the spatial patterns of August temperature anomalies in the #Arctic versus #Antarctic by decade... Data from doi.org/10.24381/cds...
 Zack Labe (@zacklabe.com) reply parent
Thank you for your continued support!
 Zack Labe (@zacklabe.com)
Watch our planet warm - and especially tune into the last decade... 100 years of January-July temperature compared to average over land areas through this year. Data provided by NOAAGlobalTemp v6.0.0: www.ncei.noaa.gov/products/lan...
 Zack Labe (@zacklabe.com)
Loss of thicker July sea ice from 1979 to 2025... Note that I have masked out sea ice < 1.5 meters in order to emphasize the decline of the (relative) thicker ice. Data from PIOMAS. You can compare this animation with a more realistic version here: zacklabe.com/arctic-sea-i...
 Zack Labe (@zacklabe.com)
Maps of temperature departures averaged over the last month (left), 3 months (center), and 12 months (right) across the #Arctic... Data available from doi.org/10.24381/cds...
 Zack Labe (@zacklabe.com) reply parent
That is correct. Check out this explainer: bsky.app/profile/carb...
 Zack Labe (@zacklabe.com)
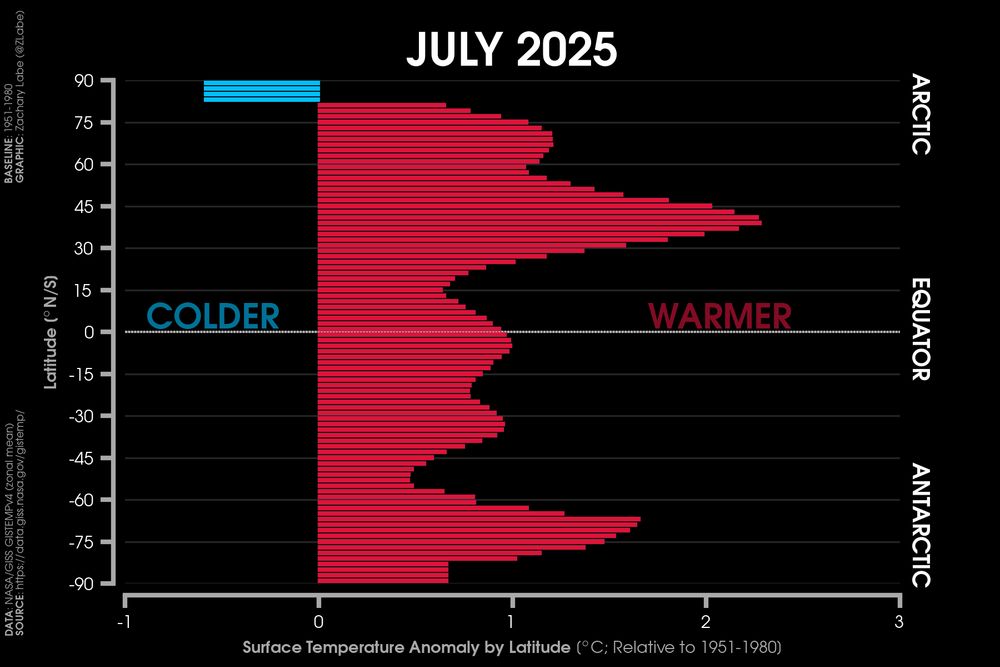
More cool conditions this summer in the #Arctic, contributing to no new sea ice records. Otherwise, above average temperatures were found elsewhere in July. Plot shows zonal-mean temperature anomalies, where latitude = y-axis (not scaled by distance). Data: GISTEMPv4 using their 1951-1980 baseline
 Zack Labe (@zacklabe.com) reply parent
Not entirely; check out our study: doi.org/10.1175/JCLI...
 Zack Labe (@zacklabe.com)
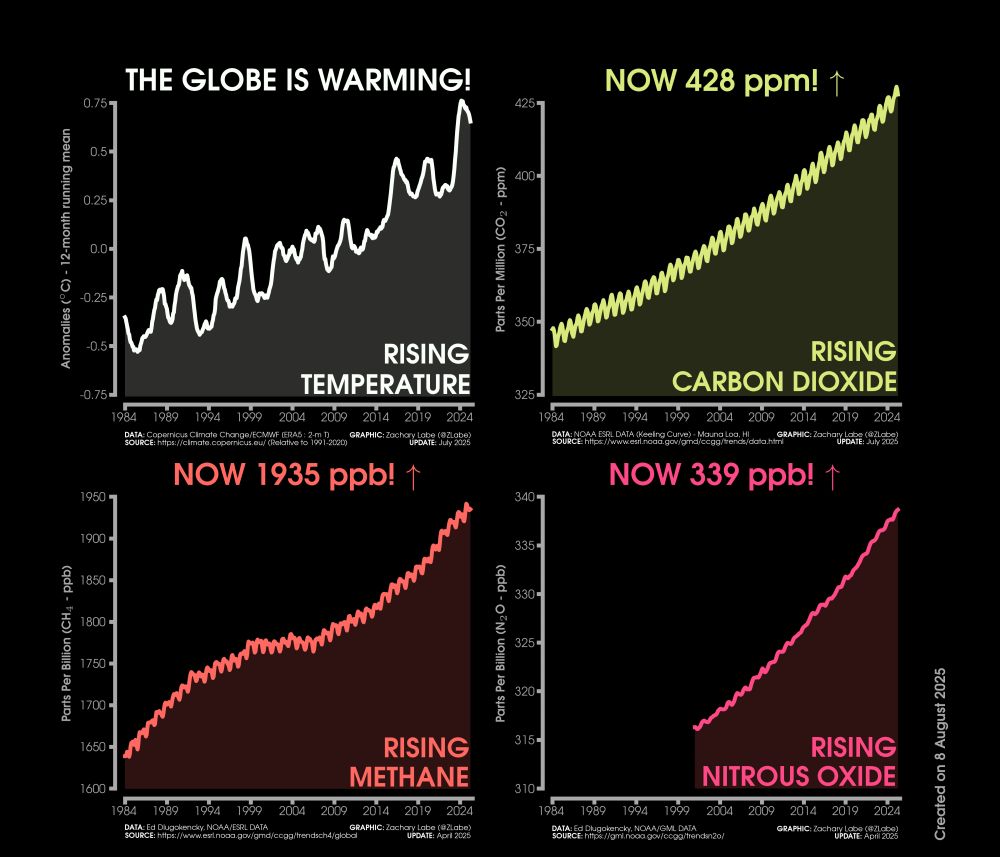
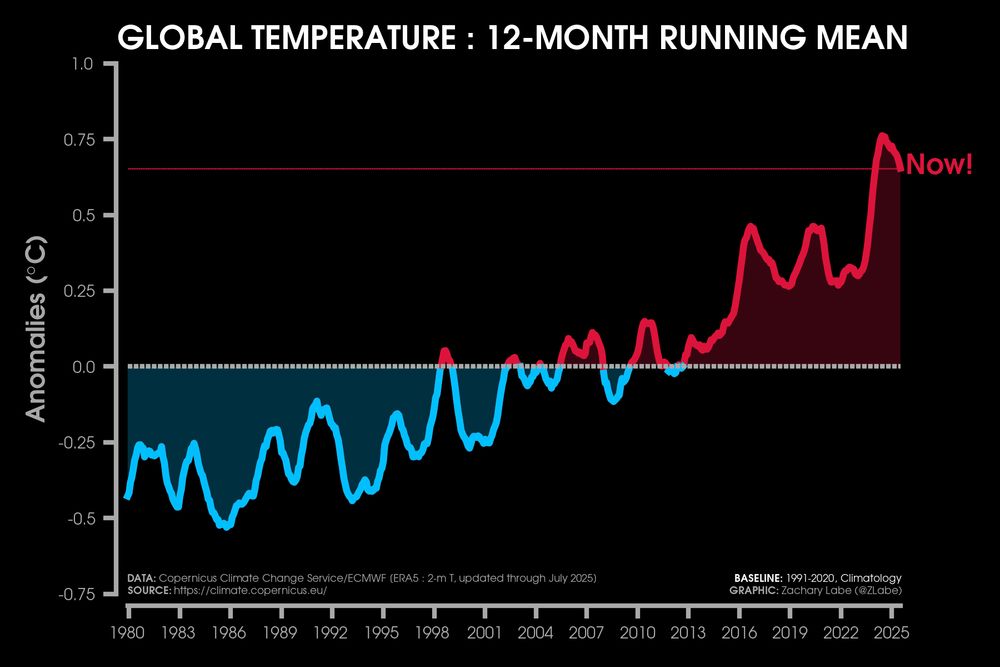
Here's an updated view of the 12-month running mean global temperature, which is a simple metric that provides insight on climate change and climate variability. + Graphic from global climate change indicators: zacklabe.com/climate-chan...
 US Association of Polar Early Career Scientists (USAPECS) (@usapecs.bsky.social) reposted
📣 Join us for our next webinar on an introduction to #Arctic disaster risk reduction! This event is held in collaboration with our partners at the Arctic Risk Management Network (ARMNet). 💻 Please register for free in advance at iarpc.zoom.us/meeting/regi... & contact @zacklabe.com for questions.
 Zack Labe (@zacklabe.com) reply parent
Check out some of my new maps here... bsky.app/profile/zack... (warming hole is still visible)
 Zack Labe (@zacklabe.com) reply parent
It remains very relevant. Even accounting for the Dust Bowl outliers years, there has been limited daytime warming in many areas from the upper Midwest to the Southeast. This analysis helps us to understand and model local trends in the atmospheric circulation as well as land-atmosphere interactions
 Zack Labe (@zacklabe.com)
"It’s getting hotter, longer, more humid and more dangerous. Yet averages elide a complex reality: The country’s experience of hotter summers — and thus one of the most visceral aspects of climate change itself — is fractured along geographic lines." More on the Central U.S. warming hole ⬇️
 Zack Labe (@zacklabe.com)
100 years of July sea surface temperature anomalies updated through 2025. While there is large yearly variability, our oceans are getting much warmer. This is fueling powerful storms, affecting marine ecosystems, and increasing coastal flooding and erosion. Data from psl.noaa.gov/data/gridded... 🌊
 Zack Labe (@zacklabe.com)
Monday ice update - #Arctic sea ice extent is currently the 11th lowest on record (JAXA data) 🧪🌊 • about 50,000 km² above the 2010s mean • about 980,000 km² below the 2000s mean • about 1,920,000 km² below the 1990s mean • about 2,550,000 km² below the 1980s mean More: zacklabe.com/arctic-sea-i...
 Zack Labe (@zacklabe.com) reply parent
There are plans to expand it, with already some preliminary testing in the eastern Pacific.
 Zack Labe (@zacklabe.com)
It’s now out! www.climatecentral.org/tropical-cyc...
 Zack Labe (@zacklabe.com)
"Under discussion are plans to hold a public debate about climate science, write a line-by-line rebuttal of the National Climate Assessment and ready a counterattack against climate scientists critical of last month’s Energy Department report." 🤪
 Zack Labe (@zacklabe.com) reply parent
 Zack Labe (@zacklabe.com) reply parent
I have data through July 31st here: zacklabe.com/arctic-sea-i...
 Zack Labe (@zacklabe.com) reply parent
Yep, sorry for the typo!
 Zack Labe (@zacklabe.com)
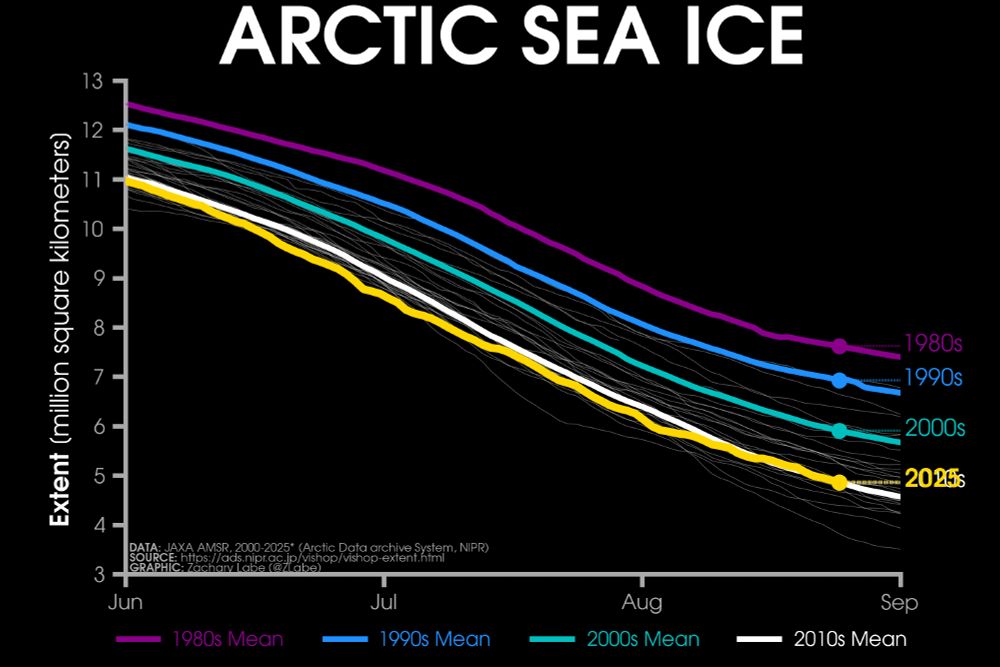
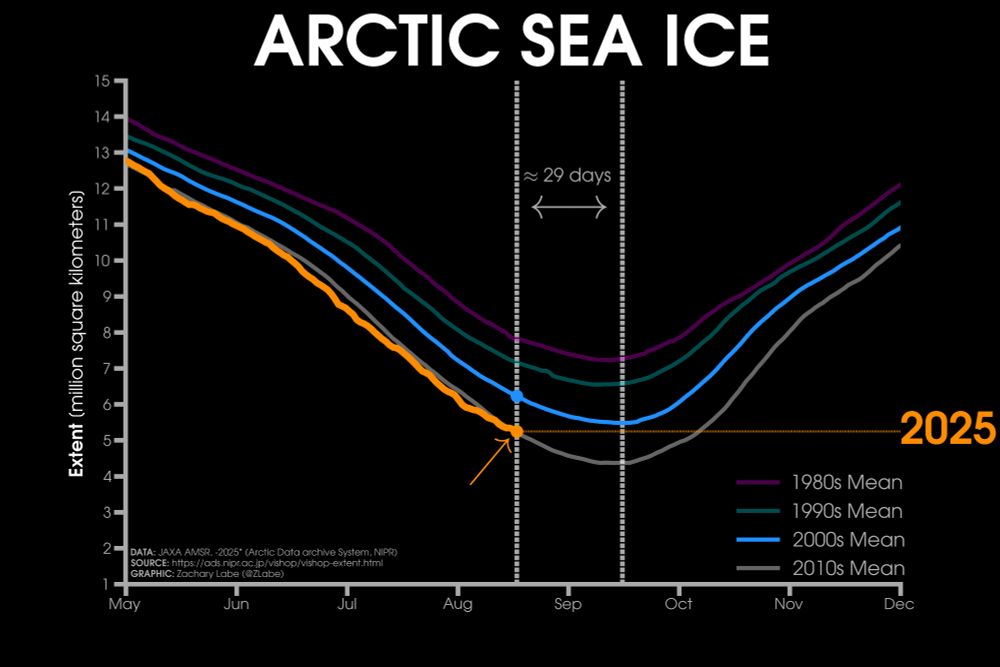
Arctic sea ice grows and shrinks during the year (seasonal cycle). It reaches its annual minimum extent at the end of every summer (early-mid September). Currently, 2024's sea ice extent is already below the minimums from the 1980, 1990, and 2000 decadal averages [JAXA data]
 Zack Labe (@zacklabe.com) reply parent
I'm glad it's helpful! I will have to dive into that some more :)
 Zack Labe (@zacklabe.com) reply parent
Here is the formula I used: www.wpc.ncep.noaa.gov/html/heatind.... But there are a number of different heat index metrics, which I would also like to compare here.
 Zack Labe (@zacklabe.com)
Hope this start is helpful... just added some preliminary metrics for heat and humidity on my climate indicators page 🥵 📊 zacklabe.com/united-state...
 Zack Labe (@zacklabe.com)
"Daily average temperatures reached a CSI level 5 across Japan and South Korea from mid-June to early August. Several cities saw over a month of CSI 5. A CSI 5 indicates that human-caused climate change made this event at least five times more likely, signaling an exceptional climate change event."
 Zack Labe (@zacklabe.com) reply parent
🥰
 Zack Labe (@zacklabe.com) reply parent
Thank you!! :)
 Zack Labe (@zacklabe.com)
Long-term trends in Arctic sea-ice concentration are much more widespread in August (and September) than during other months. The largest declines are in parts of the Chukchi and Beaufort Seas. Sea ice concentration = fraction of ice-cover. More info at journals.ametsoc.org/view/journal...
 Zack Labe (@zacklabe.com)
100 years of July temperature anomalies over land areas through 2025... Data from NOAAGlobalTemp v6.0.0: www.ncei.noaa.gov/products/lan...
Zack Labe (@zacklabe.com)


