
Modeled reconstruction of July #Arctic sea ice volume since the year 1901 - comparison between PIOMAS-20C and PIOMAS data sets now updated through 2025... Data information available at doi.org/10.1175/JCLI...
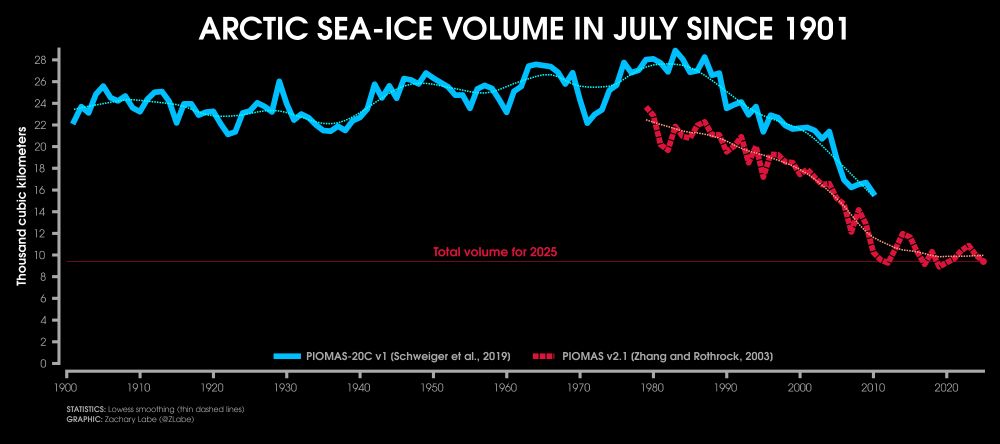
Modeled reconstruction of July #Arctic sea ice volume since the year 1901 - comparison between PIOMAS-20C and PIOMAS data sets now updated through 2025... Data information available at doi.org/10.1175/JCLI...

Non-scientist here. Can you help me understand news stories in the last year or so that mention increases in Antarctic sea ice?
I am sorry, but I don't know what you are referring to. Antarctic sea ice is currently the 2nd lowest on record: zacklabe.com/antarctic-se...

If it increased from last year being the lowest, there is the rhetorical trick that gives you your answer.