
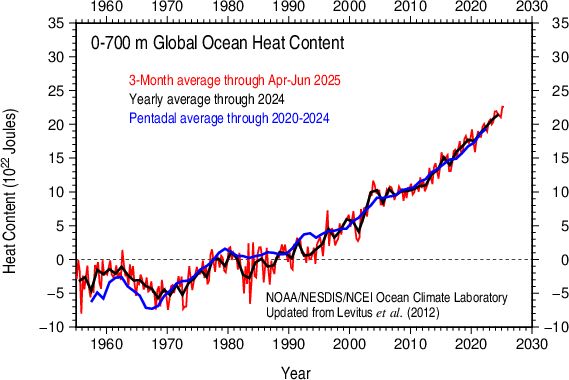
Upper ocean heat content (0 to 700 m depth) also set a new record high with the latest June data update (see my earlier post). Yikes! 🌊 Graphic/data (anomalies) from www.ncei.noaa.gov/access/globa...
Upper ocean heat content (0 to 700 m depth) also set a new record high with the latest June data update (see my earlier post). Yikes! 🌊 Graphic/data (anomalies) from www.ncei.noaa.gov/access/globa...

No end in sight.

But this year we didn't have a ton of hurricanes so clearly it's fine 🫠 (/s)

Could you demystify the scale for me?
I'm assuming zero is a normalized value?
Yeah this graphic is incredibly confusing, but I haven't had the time to remake it myself. It's showing anomalies relative to 1955-2006.

And that was before the hot weather in July and August.