
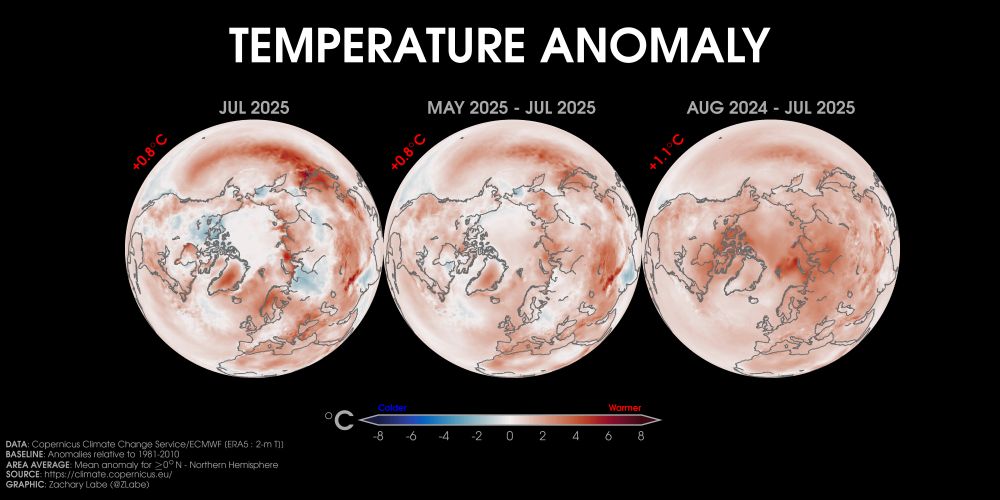
Temperature anomalies averaged over the last month (left), 3 months (center), and 12 months (right) across the Northern Hemisphere... Data from @copernicusecmwf.bsky.social ERA5 reanalysis.
Temperature anomalies averaged over the last month (left), 3 months (center), and 12 months (right) across the Northern Hemisphere... Data from @copernicusecmwf.bsky.social ERA5 reanalysis.

Why are you posting these without explanation? Don't we need to broaden your audience?
Suggest you go to his main ID and website; he provides more and better updated data than anybody else. bsky.app/profile/zack...
Thanks, but what I want him to do is to reach the general reader who knows little about climate change.

Gosh the waters off and around the Japanese Archipelago stick out like a sore thumb 😳 I wonder if recent marine heatwaves around Japan (fueled by climate change + a -PDO) are intensifying sea effect snow in the Japanese Alps and Hokkaido.