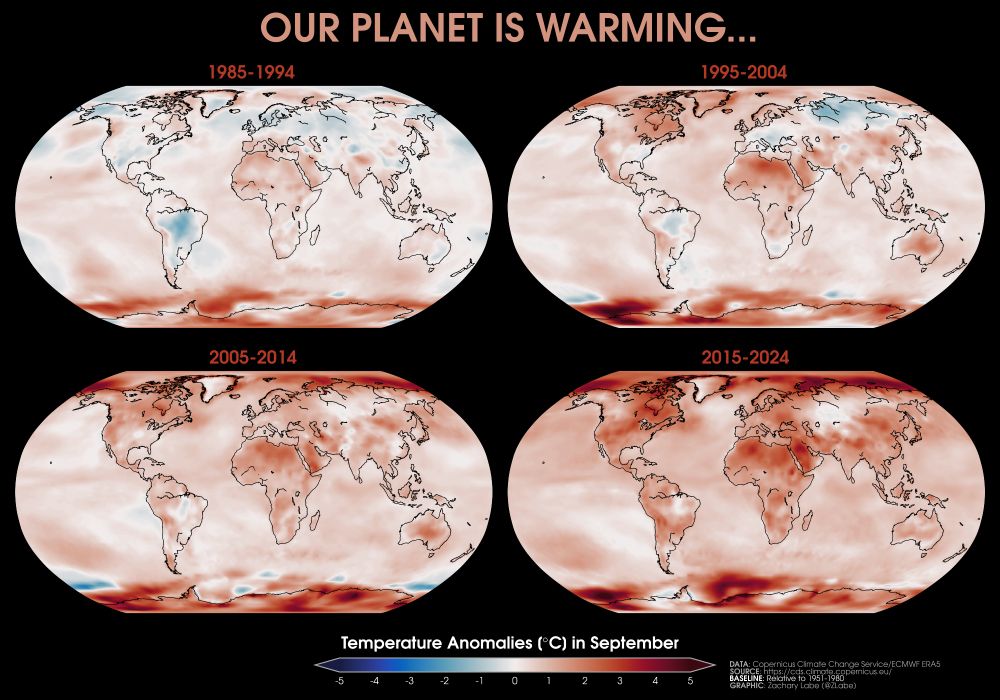
The story told by those four graphics is horrific.
sep 1, 2025, 7:02 pm • 1 0 • view
The story told by those four graphics is horrific.
The 85 to 92 is a bit misleading because of Mt Pinatubo going off. In 92, we had frost in June because of it.
I'm simply showing the decadal averages.
Any small shades of blue disappeared. What’s to be the fate of that pale blue dot. The only home humans have ever known.
The dot will be fine. The humans? Well if we don't change our behaviours quickly, then not all 8 billion of them are going to make it.
Btw, do you have decade global maps for autumn going back to 1850-1859 using the NOAAGlobalTemp v6.0.0 dataset (doi.org/10.25921/rzx...)? Be interesting to see tbh.