
Three weeks later, this is still holding up--percentage of deaths due to pneumonia/influenza/covid in the US is still at 2019 levels, as we approach the peak of the summer covid wave. Lines mark Week 34 in each year. 1/
Three weeks later, this is still holding up--percentage of deaths due to pneumonia/influenza/covid in the US is still at 2019 levels, as we approach the peak of the summer covid wave. Lines mark Week 34 in each year. 1/
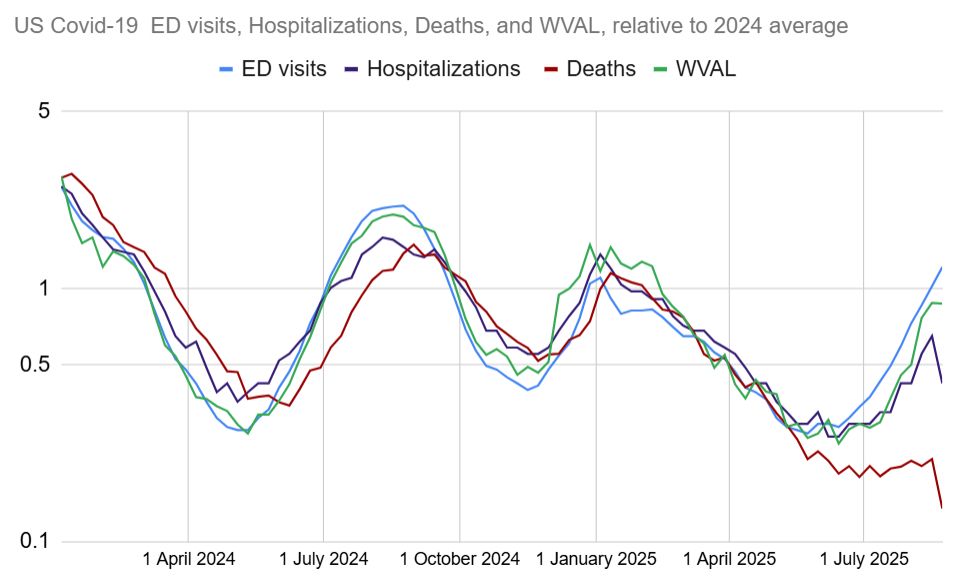
Here are US covid ED visits, hospitalizations, deaths, and wastewater viral activity level all relative to their 2024 averages. Deaths have been low relative to other metrics for months. 2/
Data sources: gis.cdc.gov/grasp/fluvie... covid.cdc.gov/covid-data-t... www.cdc.gov/nwss/rv/COVI... 3/3

Sweden is down to about 1/5 of the winter 2022/2023. But old and disabled are still getting vaccinated here.

Good. Why would deaths veer relative to hospitalization and EV visits? But it’s nice to see.
I don't know the answer. Some guesses: (1) lower severity affects the more severe outcomes (death, ICU, hosp) relatively more. Severity could be lower because (1A) immune escape variants infect those with acquired immunity to a greater extent. Also infections skew younger for same reason.
Or (1B) intrinsic change in severity (no particular evidence for this). Or (2) a change in testing, or coding of deaths (no particular evidence for this either. After the wave we'll have a better picture, and can break out by age, geography, etc.