Annual totals. 2025 is highlighted with a pink dot to reflect that its total is still being added to. 2025 is the 2nd biggest year on record, in terms of lab detections of # flu -infected people (without defining severity), behind only 2024.

Annual totals. 2025 is highlighted with a pink dot to reflect that its total is still being added to. 2025 is the 2nd biggest year on record, in terms of lab detections of # flu -infected people (without defining severity), behind only 2024.
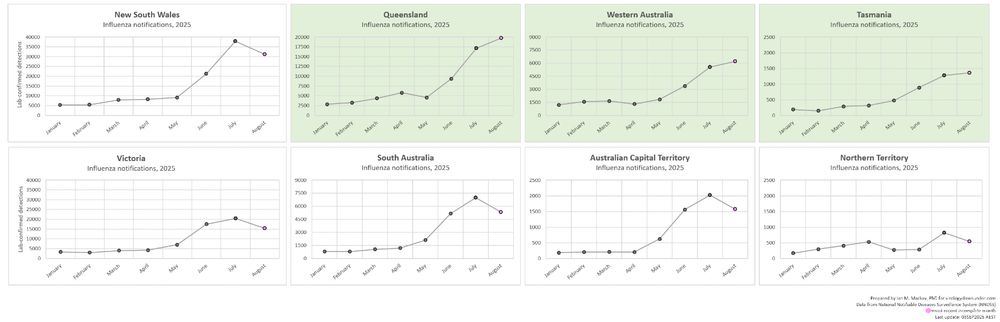
Case detections by jurisdiction & month. Pink dot at the end of a line is for this ongoing month. NSW slowing is impacting national tally the most (biggest "producer" & highest rate of detections). QLD, WA & TAS (green) peaed in August. These buck the national trend of a July peak.
Data for my graphs above come from: nindss.health.gov.au/pbi-dashboard/ Data for the pie-graph [inset above] comes from the latest national fortnightly Australian Respiratory Surveillance Report: www.health.gov.au/resources/pu...